
Empower Your Donut Model for Receipts with Self-Annotated Data
Introduction
In this article, you will learn how to fine-tune the Donut model with your own custom receipts data. Further fine-tuning the Donut model with image annotations for your specific need, can massively boost the performance of the model in the particular task. This article will use a Donut model already fine-tuned on the CORD dataset, annotate some receipts, and then use those annotations to further fine-tune the Donut model.
Story overview
- Finding an annotation tool and annotating
- Converting data to the correct format
- Training with your annotated data
Finding an annotation tool and annotating
To create your own dataset, you have to have an annotation tool. Luckily, there are plenty of tools available online. For this tutorial, I will be using the Sparrow annotation tool from this GitHub repository. Note that this is forked from another GitHub repository, and with a few changes for my specific needs which are described later in the article. How to annotate is explained in the repository, but I will display the steps you have to do below, for simplicity.
- Clone the GitHub repository (you have to clone all folders, not just the sparrow-ui folder)
- Install all required packages (requirements.txt file can be found within each subfolder in the Sparrow repository, use the one from sparrow-ui)
- Run the Streamlit application by going into the sparrow-ui folder, and running: streamlit run main.py
- A window will now open in your browser, and you can then choose the data annotation page
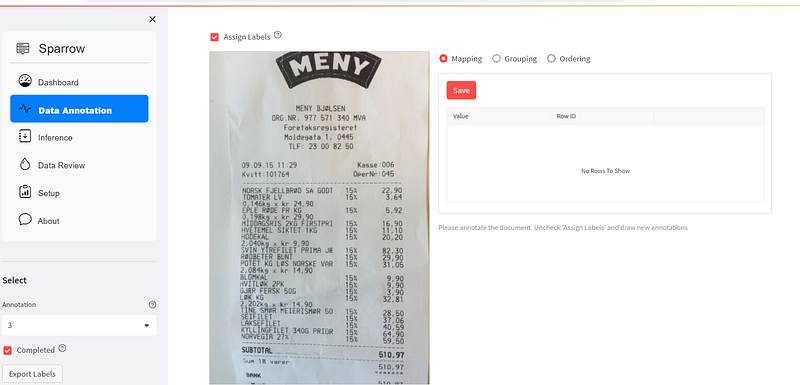
- On the data annotation page, press browse files and choose an image you want to annotate (should be an image of a receipt) or use one of the existing images already in the GitHub repository.
- Make sure the assign labels box is unchecked, and mark an area in the picture.
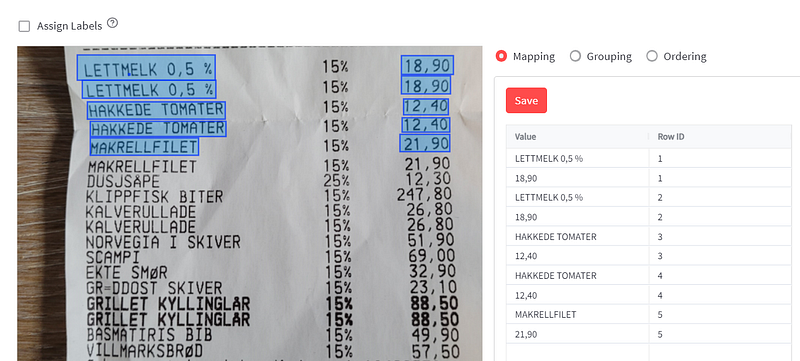
- After selecting all areas you want to mark, check the Assign Labels box. Then press a box, and write the text of the box in the Value column, and the Row number in the Row ID column. Note the number of the Row ID only requires 2 things. Words and numbers of the same row must have the same Row ID, and the total needs to have the highest Row ID. Make sure to press the save button after adding values. To understand this fully, check out the image below.
8. Now check the Completed checkbox on the left side, and press export labels. You will receive the images with labels in the docs folder
For your information, I made 2 changes to the original Sparrow repository which I forked:
- Allowing uploading of several images
- Under Mapping, I changed the Label column to take any value and called it Row ID instead.
You do not have to do anything regarding the changes, but now you are aware of what has changed in the fork from the original Sparrow repository.
Converting data to the correct format
Now that you have images that are labeled with bounding boxes, the text in the bounding boxes, and the Row ID of the bounding boxes, we have everything we need to convert the data to the same format as the CORD dataset. Note that Sparrow has a folder called sparrow-data, which converts data to Donut format, though I did not find functionality there that fit my needs (as I wanted to specify the Row number).
Converting the data to the correct format can be confusing, as the CORD format consists of nested dictionaries. For this article, however, I have already prepared a finished script to convert your data which I store in a new file called “prepareData.py”. All you need to do is run the code below inside the sparrow-ui folder:
python prepareData.py
The prepareData.py file uses the images and labels you have annotated and converts them to a Donut-friendly format. Make sure you have not changed any folder names after exporting the data from the Sparrow annotation tool (I use all the standard paths)
The prepareData.py file will then create a folder with the name DATA_FOLDER_NAME (a variable you can change inside prepareData.py). Inside the created folder, it will create 3 folders (train, validation, test) that contain your data in a format that fits for fine-tuning the Donut model.
Training with your annotated data
If you have not yet figured out how to run the Donut model properly, you can check out my freeCodeCamp article here to learn more about that.
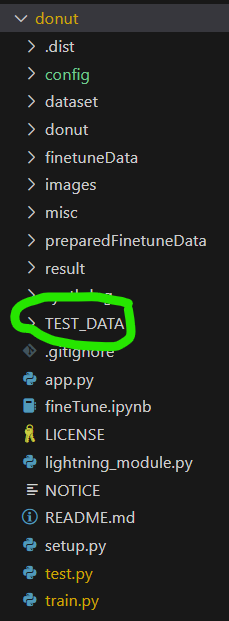
Now I assume you have the following folder structure, if “TEST_DATA” is the value of the DATA_FOLDER_NAME variable (note that the images does not necessarily have the same names):
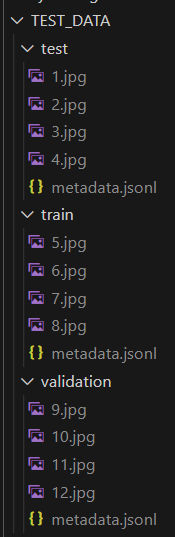
You can then copy this folder over to wherever you have your Donut model (which you can clone from here):
Now you have to make sure to change the Config file to use this data. So in your Config file (in the folder donut/config, filename that ends with .yaml), you change the dataset_name_or_paths variable to:
dataset_name_or_paths: ["TEST_DATA"]Then you can run the training with:
python train.py --config config/train_cord_finetune_own_dataset.yaml
If your Config file is called train_cord_finetune_own_dataset.yaml
Conclusion
Congrats! You can now fine-tune the Donut model with your own annotated dataset. Even though annotating a dataset can take quite some time, you do not necessarily have to make too many samples to improve the model. I recommend trying to make 50–100 samples and running fine-tuning on that. Then see if you see a significant enough improvement. I hope you learned something useful in this article.
If you want to read some of my other articles, please check out:
- ✅ Fine-tuning EasyOCR
- ✅ Generating synthetic images with Synthdog
- ✅ Download and run Llama2 locally on Windows
In Plain English
Thank you for being a part of our community! Before you go:
- Be sure to clap and follow the writer! 👏
- You can find even more content at PlainEnglish.io 🚀
- Sign up for our free weekly newsletter. 🗞️
- Follow us on Twitter(X), LinkedIn, YouTube, and Discord.


