Develop Doctor.ai with Synthetic Patient Data from Synthea
Discover patient pattern with GPT-3 and Neo4j
While the individual man is an insoluble puzzle, in the aggregate he becomes a mathematical certainty. You can, for example, never foretell what any one man will do, but you can say with precision what an average number will be up to. Individuals vary, but percentages remain constant.
— Sherlock Holmes in “The Sign of the Four”
In my previous posts (1, 2, 3, 4, 5, 6, 7 and 8), I have described our medical voice chatbot Doctor.ai. In its database, Doctor.ai manages a large amount of medical records. These records represent the medical journeys of many individual patients. As Sherlock Holmes said in The Sign of the Four, the aggregate is predictable, even though the individual is not. A seminal example is that John Snow used a dot map and statistics to identify a public water pump as the source of the cholera outbreak in London in 1854. So with careful data mining, it is possible to induce patient patterns from these medical data, such as the infection and death data broken down by race and ethnicity during the current COVID-19 pandemic (9).
Doctor.ai was developed originally with the eICU dataset. That dataset is large. But it has three drawbacks. Firstly, the dataset is not easily accessible because it was derived from real-life patients. Secondly, the data quality varies among institutions. And lastly, the data comes from the ICU and not from clinic visits. These points make eICU an ill-suited stand-in for the development of general-purpose healthcare chatbot. The excellent post Modeling Patient Journeys with Neo4j by Ravi Anthapu and Matt Holford comes to our rescue. It introduces Synthea and it is an excellent replacement.
The description from healthit.gov summarizes Synthea really well.
Synthea™ is an open-source, synthetic patient generator that models the medical history of synthetic patients. It provides realistic, but not real, patient data and associated health records covering every aspect of healthcare. The resulting data is free from cost, privacy, and security restrictions, enabling research with health information technology data that is otherwise legally or practically unavailable.
It means that I can use the Synthea data to calculate general statistics and develop recommendation algorithms over the synthetic patients. And I later can apply these algorithms to the real-world problems and serve the real patients. Because Synthea is free from privacy and security restrictions, everyone can use the data immediately without a lengthy application process — like the one required by eICU.
In this article, I replaced the eICU data with Synthea data in Doctor.ai. Furthermore, I trained GPT-3 from OpenAI to cover English questions into a series of Cypher queries that can uncover patient patterns. The code for this project is hosted on GitHub.
1. Synthea data generation and Neo4j import
I use the well-designed data model by Matt et al. in this project. Although they have mentioned the processes of data generation and import in their post, the description was scattered over several links and the import script unfortunately contains errors. I would like to describe the correct process here fully and point out the pitfalls to save the readers some trouble.
First, clone the Synthea repository to your hard drive. Then overwrite the file synthea.properties in src/main/resources/ with synthea_files/synthea.properties from the repository. Finally, go to the root level of your Synthea folder and run this command. Adjust the patients’ amount with the -p option. In this project, you only need 1,000 patients.
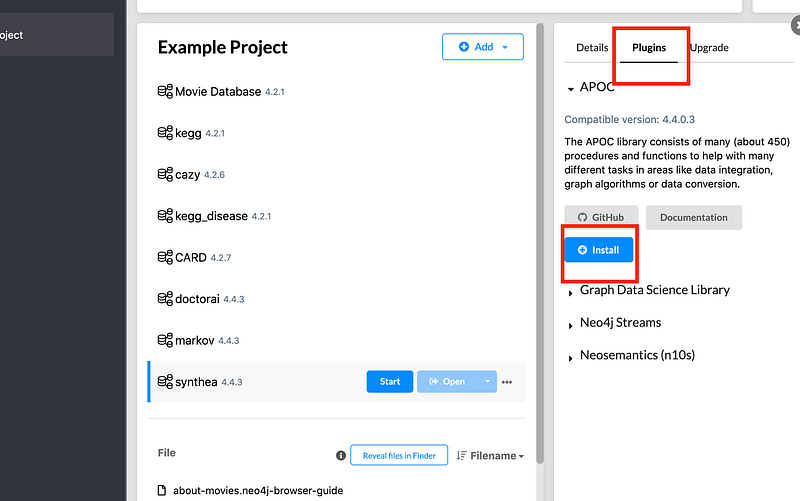
You will find a collection of CSV files in the output/csv/ folder. Now create a Neo4j project in your Neo4j Desktop. Install the APOC plugin, otherwise the import will fail.
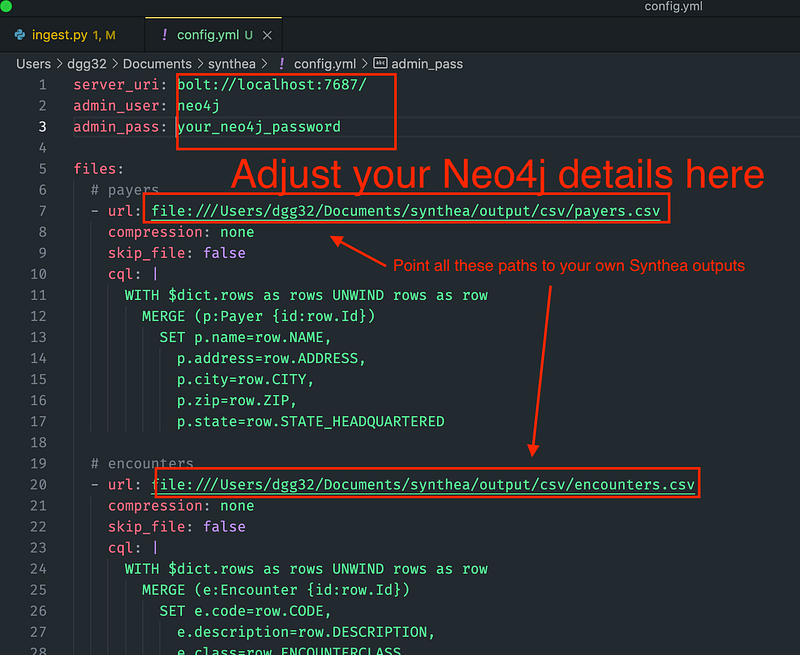
The original config.yml by Matt et al. has mistaken the Organization label with the Provider label when it parses encounters.csv. This error has been corrected in my script. You can find the improved config.yml in the repository. Fill in your database details at the first three lines. If your Neo4j is on the cloud, set its public IP address in server_uri. Modify all the file urls in the file, too.
Afterwards, clone the pyingest project. Then go to its directory, install the requirements and finally carry out the command with the config.yml location from the previous step. Wait until the command finishes.
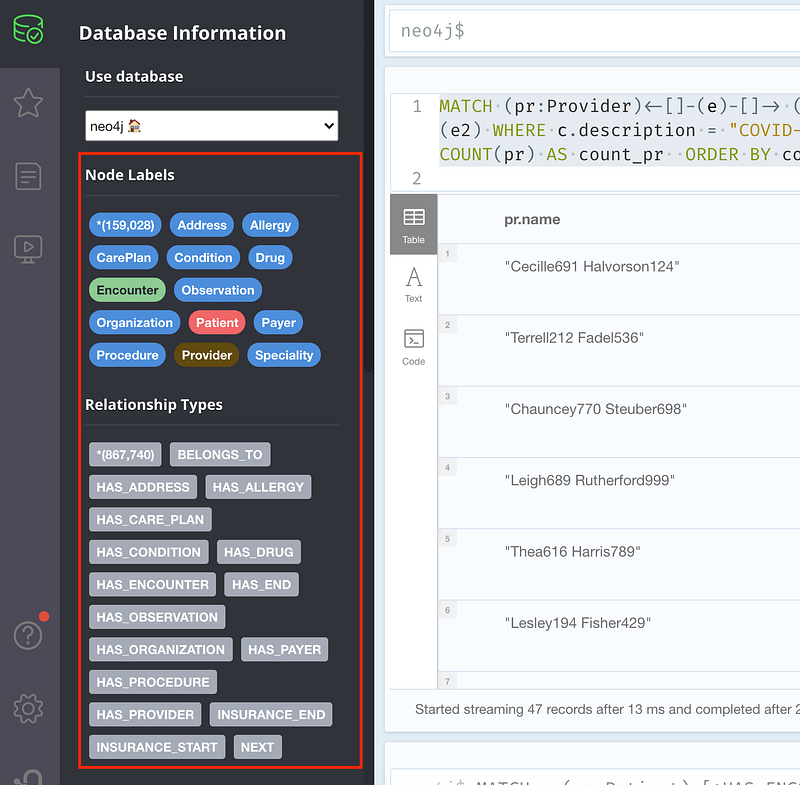
If you can see these node and relation labels on the sidebar of your Neo4j project, the import was successful.
2. Patient patterns in Cypher
It is GPT-3’s job to translate English into Cypher queries for Doctor.ai. Before I can get some statistics from Doctor.ai, I need to figure out the Cypher queries first. Then GPT-3 can learn from the English-to-Cypher pairs and do the translations later in production. For example, to calculate the amount of COVID-19 infections broken down by race and ethnicity, I can compose the following Cypher.
Similarly, I can calculate how many COVID patients each doctor (called “Provider”) and hospital (called “Organization”) treated.
I can also count how often each kind of drug was administered to treat “Viral sinusitis”.
It is worth mentioning that the descriptions of type Condition often contain items such as “Has a criminal record” or “Full-time employment”. Here we are only interested in items with the “(disorder)” flags.
Finally, both doctors and hospitals have addresses. I can ask for them like this.
3. Test the English to Cypher conversion by GPT-3
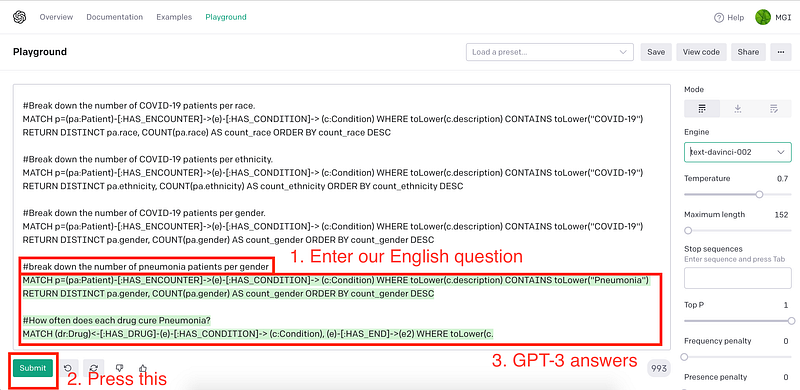
As the previous article has demonstrated, I now just need to construct some English-Cypher pairs for GPT-3.
This serves as the prompt header for our GPT-3 API query. You can test the power of GPT-3 in the Playground.
4. Set up the Doctor.ai frontend
I have updated the Doctor.ai frontend so that it can now show HTML tables in its response. Simply fork the repository and follow the steps described in my previous article How to Integrate Alan’s Speech-to-Text Engine into Doctor.ai.
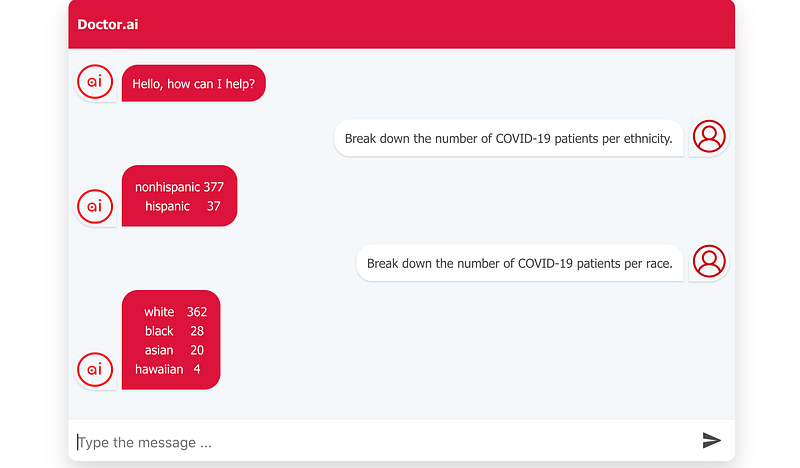
After Amplify finishes the deployment, I can test the new Doctor.ai. It is worth mentioning that this is synthetic data and the results below are not real. First, let’s see how many COVID-19 patients there were among the different ethnic groups.
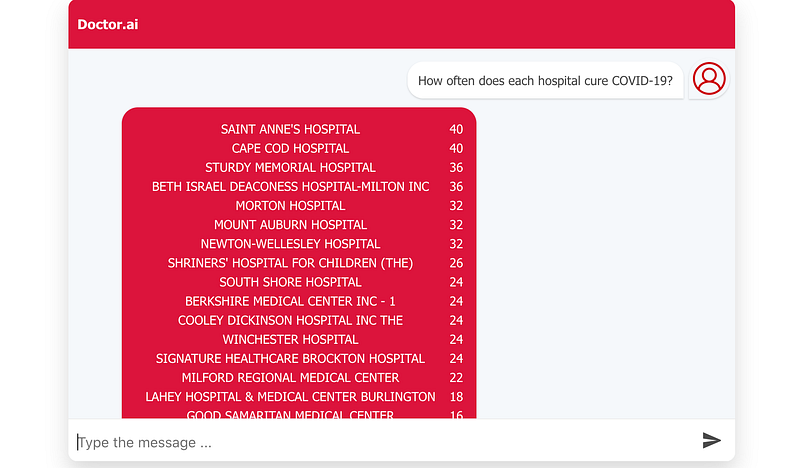
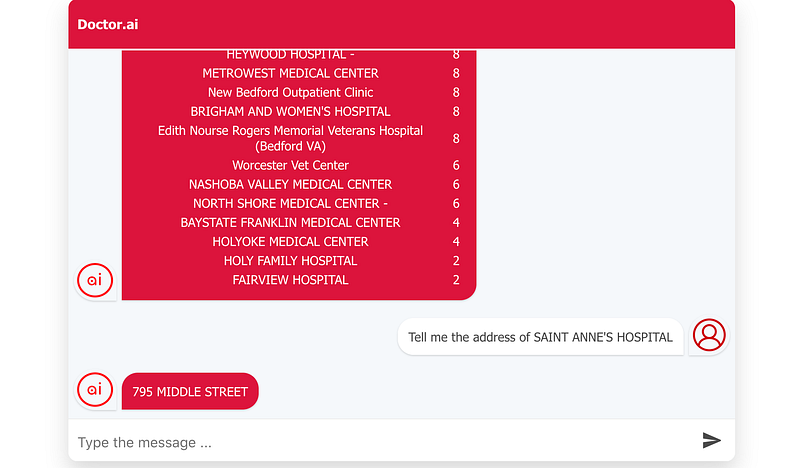
If I want to find the hospitals with the most successes in curing COVID-19, I can ask Doctor.ai. And it can give me the addresses, too.
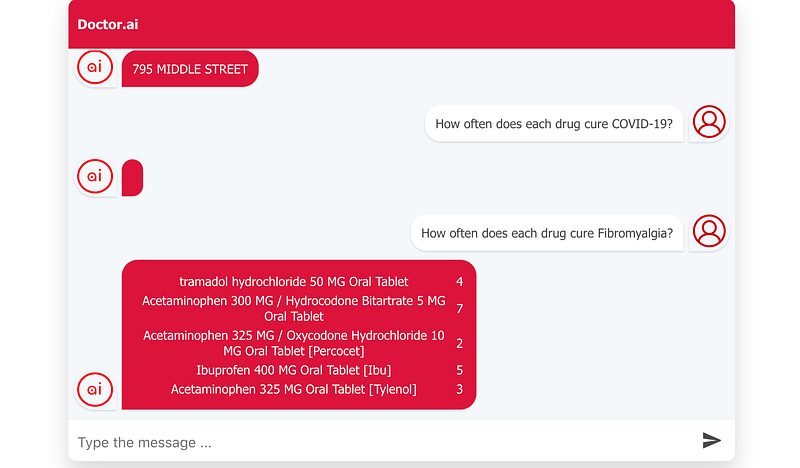
Finally, I can see how often each drug regimen has been used to treat Fibromyalgia (“COVID-19” yielded no result).
Conclusion
In this article, I have replaced the eICU stand-in data with Synthea data in Doctor.ai. Compared to eICU, Synthea is easier to work with because Synthea’s clinic data is more complete and requires no application process. But it is not perfect. For example, the descriptions in the “Condition” table should be more coherent. And diagnoses have not been yet available there. ICD-11 is also desirable.
Doctor.ai has got a small facelift and it can now display tables and other HTML elements. But it is still far away from the beautiful interface that we see in Bebot from Bespoke (here and here). So the next step is to implement multimedia support in Doctor.ai’s interface.
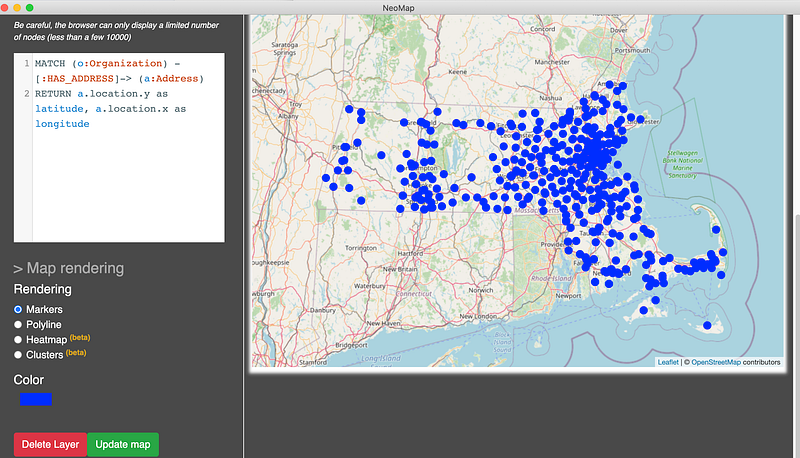
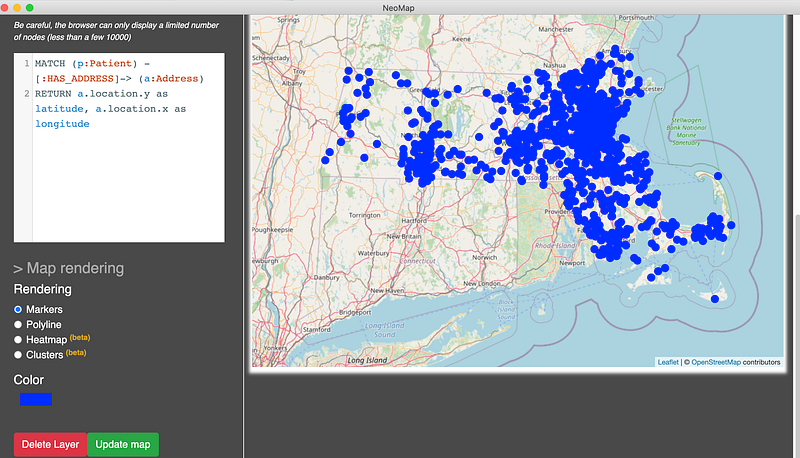
As a small bonus, Matt et al. has encoded the coordinates as point objects. Let’s plot them with the Neomap Graph App. For example, the following plots show the locations of both the hospitals and patients on the map. It is apparent that they all come from Massachusetts.