
Dashboards in Python Using Dash — Creating a Data Table using Data from Reddit
Mine Reddit for NLP and Share with Dash

Collecting NLP Datasets
I’m always looking for new ways to collect and analyze data, so as a Natural Language Processing (NLP) enthusiast, I jumped at an opportunity to scrape and analyze some Reddit data. Like Twitter, the social network Reddit contains a jaw dropping amount of information that is easy to scrape with a little code. If you want to build a natural language processing dataset about ANY topic, I highly recommend learning about Reddit to data-mine its rich communities called subreddits. In this article, I share how easy it is to download, analyze and build a dashboard using Dash and Reddit data.
This article walks you through a lot of stuff: Getting Reddit API key, using PRAW, and Creating a New Dashboard. All code is available at the end of the article if you already know PRAW!
Although Reddit has an API, the Python Reddit API Wrapper, or PRAW for short, offers a simplified experience. PRAW supports Python 3.5+, and the documentations recommends you have an understanding of both Python basics and Reddit before using the library. If you know python but not Reddit, keep reading!
This post is going to be a deeper dive into what the DashTable library has to offer. If you’re brand new to Dash or need a refresher and want to code something cool, check out my introductions to Dash.
Introduction to Dash for Beginners and Everyone Else Introduction to Streaming Data in Dash
Getting Started with Reddit API
A user account to Reddit is required to use the API. It is completely free and only requires an email address! If you’re completely new to Reddit, check out their help documentation. It is a social network that works like an internet forum allowing users to post about whatever topic they want. Users form communities called subreddits, and they up-vote or down-vote posts in their communities to decide what gets viewed first and what sinks to the bottom. It is quite fascinating:
Manage your API keys
If you’re new to managing your keys, make sure to save them into a config.py file instead of hard-coding them in your app. API keys can be very valuable and must be protected. If you’re worried your key has been leaked, create a new app or try to regenerate them.
Add the config.py file to your gitignore file to prevent it from being pushed to your repo too!
Registering an App for Keys
If there is a way to get here using the new Reddit UI, leave me a comment! If it is your first time, I recommend following these steps to get an API key after signing into Reddit. If you already have a key, use this link to go to your apps page.
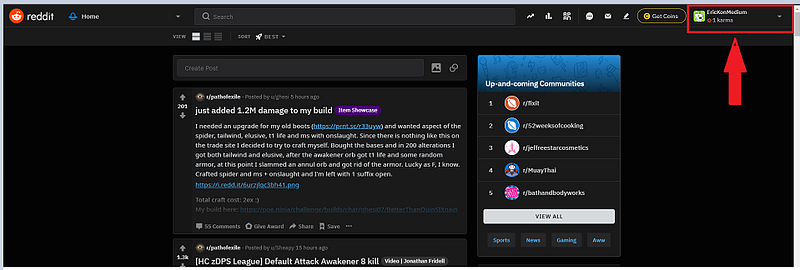
Click the User Account droplist. User options display.
Click Visit Old Reddit from the user options. The page will change and the URL will become https://old.reddit.com/
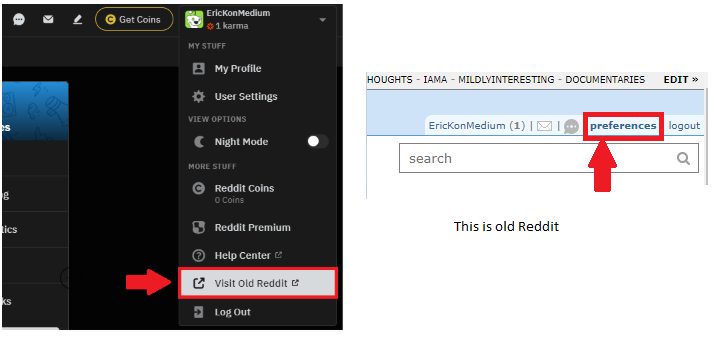
Click the preferences link next to the logout button. Click the apps tab on the PREFERENCES screen. Click the are you a developer? create am app… button.
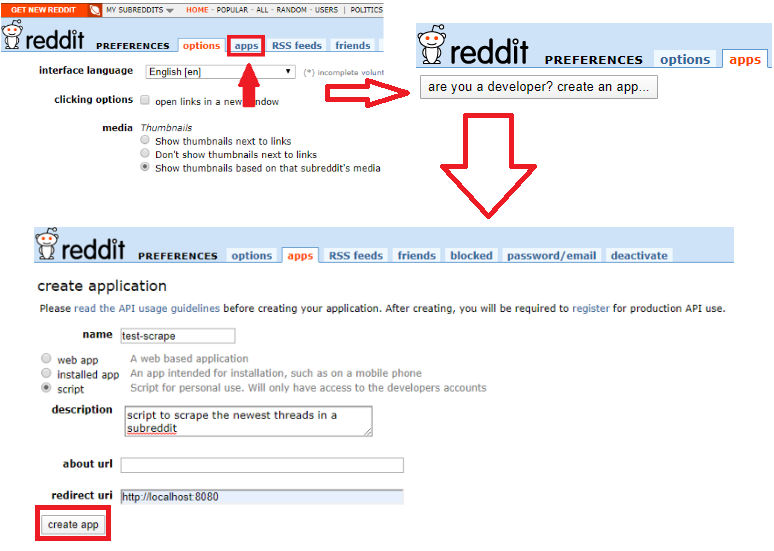
Enter a name. Select the type of app. Enter a Description. Use http://localhost:8080 as the redirect uri. Click create app after populating the fields.
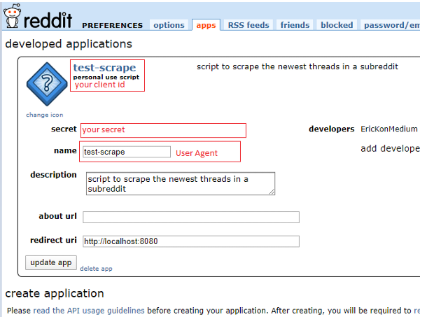
The API information required to connect will display. I’ll walk through connecting to the API using PRAW when I get into code.
Congratulations on getting set up to scrape Reddit data!
File Structure and Config
Now that Reddit is configured, it is time to plan the dashboard! I’ll keep this simple compared to the multi-page wine review dashboard. The code to pull data from Reddit and the code for the dash application will all be in one file.
Top_Folder |_config.py |_app.py
Installation and Dependencies
The recommended way to install PRAW is to use pip. The install the following packages to create the dashboard.
pip install praw, pandas, dash, dash-bootstrap-componentsStart by importing the libraries and the config file:
import praw
import pandas as pd #from config import cid, csec, uaCreate a Reddit Instance
Using PRAW, it is easy to create a read-only Reddit instance. That means I don’t need to enter Reddit credentials used to post responses or create new threads; I only need to use the API credential. The connection only reads data.
PRAW uses OAuth authentication to connect to the Reddit API.
#create a reddit connection
reddit = praw.Reddit(client_id= cid,
                     client_secret= csec,
                     user_agent= ua)
Identify Subreddits
There are so many subreddits to choose from! Regardless of your hobby, there is a sub for you. Here is a list of examples I think would be fun to explore.
news, datascience, learnmachinelearning, gaming
Exploring Objects and Attributes
Use the Subreddit class in PRAW to retrieve the data from the desired subreddit. It is possible to order the data based on the follow Reddit options:
- hot — order by the posts getting the most traffic
- new — order by the newest posts in the thread
- top — order by the most up-voted posts
- rising —order by the posts gaining popularity
If you want to include multiple subreddits, use a + symbol:
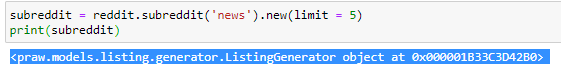
#single subreddit new 5
subreddit = reddit.subreddit('news').new(limit = 5)
#multiple subreddits top 5
subreddit = reddit.subreddit('news' + 'datascience').top(limit = 5)This returns an object that holds the data in an attribute. The attribute is like a key in a dictionary.
The data is linked to an attributed owned by the object. If the attribute is the Key, the data is the Value. The attributes are dynamically generated, so it is best to check what is available using Python’s built-in vars() function.
Use this boilerplate code to see all the attributes owned by object representing the reddit post. It is a LONG list!
subreddit = reddit.subreddit('news').new(limit = 1)
for post in subreddit:
    pprint.pprint(vars(post))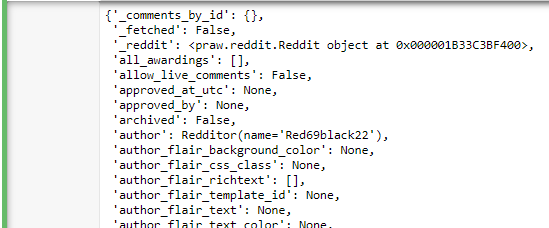
Notice in the list the attributes of interest:
title — Returns post title. score — Returns number of up-votes or down-votes. num_comments — Returns the number of comments on the thread. selftext — Returns the body of the post. created — Returns a timestamp for the post. pinned — Indicates whether the thread was pinned. total_awards_received — Returns number of awards received by the post.
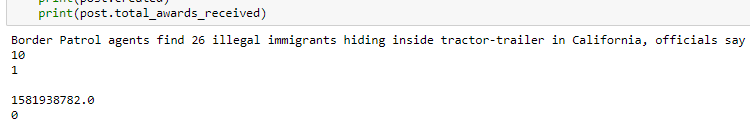
#return the attributes of interests for the first rising record
rising_posts = reddit.subreddit('news').rising(limit=1)
for post in rising_posts:
    print(post.title)
    print(post.score)
    print(post.num_comments)
    print(post.selftext)
    print(post.created)
    print(post.total_awards_received)
Notice, to print the attributes of interests for top 1 posts in the subreddit news, sorted by rising, I use a for loop.
Populate a DataFrame
Now that the attributes have been identified, it is time to load them data into a pandas DataFrame so it is easier to create features and load it into Dash. I am going to return data from the subreddit wallstreetbets. It is a subreddit that focuses on high-risk options trades and is occasionally referenced in popular news programs. Because of the emotions involved in trading, I think it will be a good source of data for sentiment analysis. Might even find a stock tip or two!
#list for df conversion
posts = []
#return 100 new posts from wallstreetbets
new_bets = reddit.subreddit('wallstreetbets').new(limit=100)#return the important attributes
for post in new_bets:
posts.append([post.title, post.score, post.num_comments, post.selftext, post.created, post.pinned, post.total_awards_received])#create a dataframe
posts = pd.DataFrame(posts,columns=['title', 'score', 'comments', 'post', 'created', 'pinned', 'total awards'])#return top 3 df rows
posts.head(3)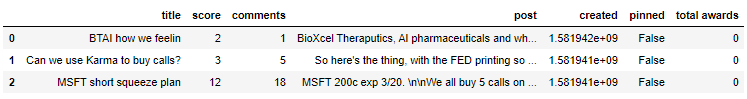
Create NLP Features
Feature engineering is a huge part of machine learning and can sometimes help models uncover relationships in the data. I am going to count words in the post column and calculate word density and unique word density. Check out my tutorial on analyzing text using the Natural Language Tool Kit if you’re interested in learning more about NLP.
Before creating new features, create a copy of the DataFrame using pandas .copy() function.
Count words in post Count Characters in post Calculate word density Count unique words Calculate unique word density
#copy the dataframe
df = posts.copy()
#count words in post
df['words'] = df['post'].apply(lambda x : len(x.split()))#count characters in post
df['chars'] = df['post'].apply(lambda x : len(x.replace(" ","")))#calculate word density
df['word density'] = (df['words'] / (df['chars'] + 1)).round(3)#count unique words
df['unique words'] = df['post'].apply(lambda x: len(set(w for w in x.split())))#percent of unique words
df['unique density'] = (df['unique words'] / df['words']).round(3)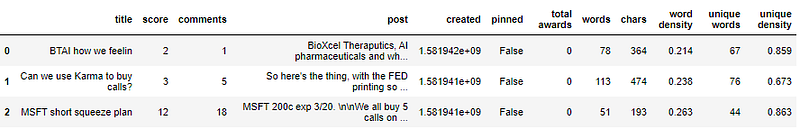
Create the Dash Files
It is finally time to code the dashboard! Remember that dashboards created using the Dash framework are composed of a layout and callbacks. When assigning an ID to a component, I find it helps to have a naming convention. I always use lowercase and separate words using a dash. For example,
‘this-is-an-example’.
DataTable Component in Dash
The DataTable component is an interactive table designed for exploring large datasets. It is easy to style because it is rendered with standard HTML, and it uses React.js under the hood making it highly customizable.
Create a simple DataTable using the dash_table.DataTable(columns, data) syntax to display the Reddit data.
layout = dash_table.DataTable(
    id='table',
    columns=[{"name": i, "id": i} for i in df.columns],
    data=df.to_dict('records')
)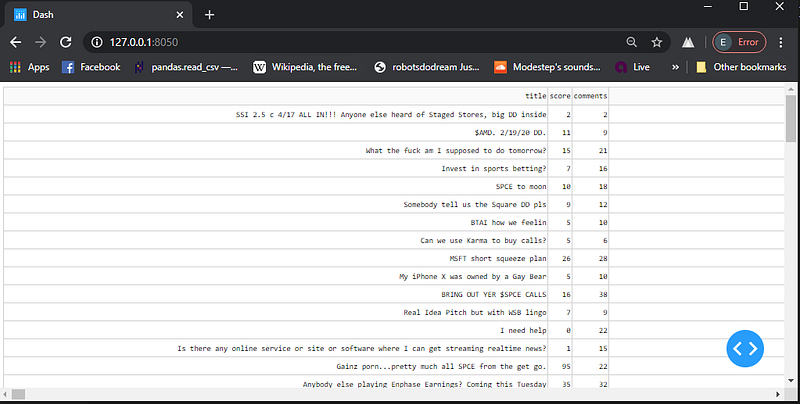
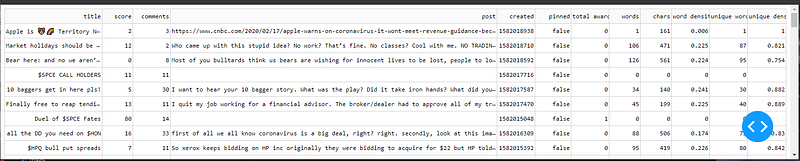
Notice the horizontal scroll bar is TINY! This occurs because there is no text-wrapping by default and one of the columns contains a very long string.
Instead of using default options, use style_* properties to style the table to your specifications!
Data Table Styling
When styling the table, it is important to think about the styling priorities to make sure one style doesn’t overwrite the other. To quote documentation:
There is a specific order of priority for the style_* properties. If there are multiple style_* props, the one with higher priority will take precedence.
1. style_data_conditional 2. style_data 3. style_filter_conditional 4. style_filter 5. style_header_conditional 6. style_header 7. style_cell_conditional 8. style_cell
Sizing
Set Columns to Overflow
As mentioned earlier, there is no text wrapping by default. I will use an overflow strategy to resize the columns in the table automatically. If your cells contain text with spaces, then you can overflow your content into multiple lines.
layout = dash_table.DataTable(
    id='table',
    style_data={
        'whiteSpace': 'normal',
        'height': 'auto'
    },
    columns=[{"name": i, "id": i} for i in df.columns],
    data=df.to_dict('records')
)
Notice the horizontal scroll is already gone! By applying some style parameters to the style_data property, I made the post data overflow into a new line. There are server other overflow strategies to reduce the need for horizontal and vertical scrolling around a page!
Instead of automatically wrapping the text to fit the screen, I can prevent the full text from displaying by using an ellipsis overflow strategy.
Combine Sizing Properties
Because the style properties have priorities, it is possible to stack them and apply multiple styles. It is possible to style the cell individually using the style_cell_conditional property.
    , style_cell_conditional=[
        {'if': {'column_id': 'title'},
         'width': '200px'},
        {'if': {'column_id': 'post'},
         'width': '670px'
         ,'height':'auto'},
    ]
    ,style_cell={
        'overflow': 'hidden',
        'textOverflow': 'ellipsis',
        'maxWidth': '50px'
    }
Notice the size of the title and post columns supersede the size set in the style_cell property because of the style priorities. Notice the code uses ‘textOverflow’: ‘ellipsis’ to prevent the column height from growing.
Set the Table Height
It is possible to set the table height so the table doesn’t consume the entire page like it does by default. Using maxHeight and overflowY : ’scroll’, it is easy to constrain the height of the table.
style_table={
        'maxHeight': '700px'
        ,'overflowY': 'scroll'
    },
A useful feature that I use when the table has a lot of columns or rows, is fixed_rows{}. Freeze a particular row by setting the data value. Columns can also be fixed using the fixed_columns{} property. I have not had luck using both at the same time.
,fixed_rows={ 'headers': True, 'data': 0 },
,fixed_columns={ 'headers': True, 'data': 1 }
The DataTable
This is the complete dataTable code so far.
dash_table.DataTable(
id='table'
, style_cell_conditional=[
{'if': {'column_id': 'title'},
'width': '200px'},
{'if': {'column_id': 'post'},
'width': '670px'
,'height':'auto'}
]
,style_cell={
'overflow': 'hidden',
'textOverflow': 'ellipsis',
'maxWidth': '50px'
}
, style_table={
'maxHeight': '700px'
,'overflowY': 'scroll'
}
,columns=[{"name": i, "id": i} for i in df.columns]
,fixed_rows={ 'headers': True, 'data': 0 }
,data=df.to_dict('records')
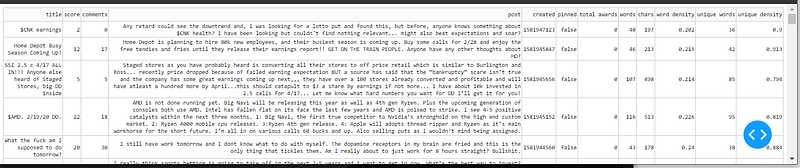
)Conditional Formatting
One of my favorite features in spreadsheets is conditional formatting, so I’m glad that data tables makes it relatively easy to code. Conditional formatting means to use a logical condition to determine the style of the cell. For example, if looking at temperatures I could color warm temps red and cold temps blue.
Apply conditional formatting using the style_data_conditional property. Filtering data uses the DataTable filtering syntax.
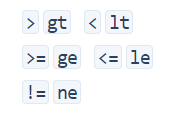
Use the letters instead of the corresponding symbol.
style_data_conditional=[
        {
            'if': {
                'column_id': 'score',
                'filter_query': '{score} gt 50'
            },
            'backgroundColor': '#3D9970',
            'color': 'white',
        },
        {
            'if': {
                'column_id': 'comments',
                'filter_query': '{comments} gt 20'
            },
            'backgroundColor': '#3D9970',
            'color': 'white',
        },
Notice the filter queries look for scores greater than 50 and comments greater than 20. Since the data is being styled, the text color is being modified by ‘color’: ‘white’.
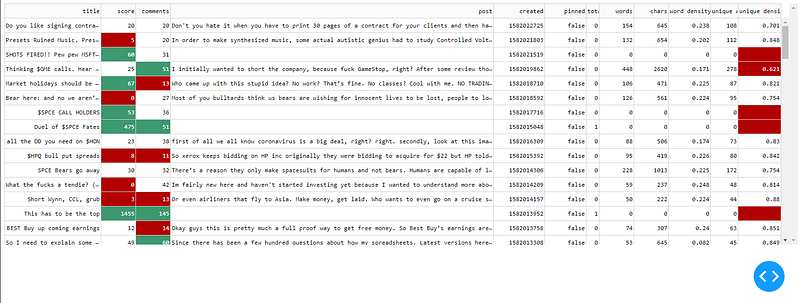
Notice it is possible to have multiple conditions per column. It is fairly easy to use copy and paste to create a ton of conditional formatting rules!
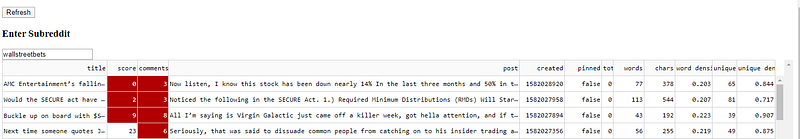
Adding a Refresh Button and Input
The dashboard is cool, but would be better with a refresh button! Below I’ll show how to add a button using the Button() dash_html_component.
Buttons can use the n_clicks value in callbacks in combination with dash.dependencies.State to pass a value without automatically firing a callback. For example, instead of live updating results as you type, State will essentially hold the values until you’re ready to submit them all at once by clicking the button. Using this combination, I added a field that allows users to input a subreddit, and then click the refresh button to return the data.
This is mostly the Reddit code wrapped in a callback function so the button can return the desired data.
app.layout = html.Div([
    html.P(html.Button('Refresh', id='refresh'))
    ,html.P(html.Div(html.H3('Enter Subreddit')))
    ,dcc.Input(id='input-1-state', type='text', value='wallstreetbets')
    ,dash_table.DataTable(
...
...
...@app.callback(Output('table', 'data'),
[Input('refresh', 'n_clicks')],
[State('input-1-state', 'value')
])
def update_data(n_clicks, subreddits):
dff = df
if subreddits is None:
subreddits = 'wallstreetbets'
else:
subreddits
if n_clicks is None:
raise PreventUpdate
else:
posts = []
new_bets = reddit.subreddit(subreddits).new(limit=100)
for post in new_bets:
posts.append([post.title, post.score, post.num_comments, post.selftext, post.created, post.pinned, post.total_awards_received])
posts = pd.DataFrame(posts,columns=['title', 'score', 'comments', 'post', 'created', 'pinned', 'total awards'])dff = posts.copy()
dff['words'] = dff['post'].apply(lambda x : len(x.split()))
dff['chars'] = dff['post'].apply(lambda x : len(x.replace(" ","")))
dff['word density'] = (dff['words'] / (dff['chars'] + 1)).round(3)
dff['unique words'] = dff['post'].apply(lambda x: len(set(w for w in x.split())))
dff['unique density'] = (dff['unique words'] / dff['words']).round(3)
return dff.to_dict('records')Notice the callback has three components: Output, Input, State. The Output is outputting new data for the data table. The Input is taking the n_clicks, and the State is waiting for the subreddit to be passed.
The Complete Code
Wow! We covered a ton of content and made a data table dashboard that can be mined for information. Now that you’re able to mine data from Reddit and load it into a styled dataTable in Dash, I encourage you to share your analytics and data collection with the world!
Check out my other articles if you’re interested in how you can expand the dashboard!
The Code
Learn how to turn this dashboard into a responsive app!
import dash
import dash_html_components as html
import dash_core_components as dcc
import dash_table
import pandas as pd
import praw
import pandas as pd
from dash.dependencies import Input, Output, State
from dash.exceptions import PreventUpdate
from config import cid, csec, uagreddit = praw.Reddit(client_id= cid, client_secret= csec, user_agent= uag)
posts = []
new_bets = reddit.subreddit('wallstreetbets').new(limit=100)
for post in new_bets:
posts.append([post.title, post.score, post.num_comments, post.selftext, post.created, post.pinned, post.total_awards_received])
posts = pd.DataFrame(posts,columns=['title', 'score', 'comments', 'post', 'created', 'pinned', 'total awards'])df = posts.copy()
df['words'] = df['post'].apply(lambda x : len(x.split()))
df['chars'] = df['post'].apply(lambda x : len(x.replace(" ","")))
df['word density'] = (df['words'] / (df['chars'] + 1)).round(3)
df['unique words'] = df['post'].apply(lambda x: len(set(w for w in x.split())))
df['unique density'] = (df['unique words'] / df['words']).round(3)app = dash.Dash(__name__)app.layout = html.Div([
html.P(html.Button('Refresh', id='refresh'))
,html.P(html.Div(html.H3('Enter Subreddit')))
,dcc.Input(id='input-1-state', type='text', value='wallstreetbets')
,dash_table.DataTable(
id='table'
, style_cell_conditional=[
{'if': {'column_id': 'title'},
'width': '200px'},
{'if': {'column_id': 'post'},
'width': '670px'
,'height':'auto'}
]
,style_cell={
'overflow': 'hidden',
'textOverflow': 'ellipsis',
'maxWidth': '50px'
}
, style_table={
'maxHeight': '700px'
,'overflowY': 'scroll'
}
,style_data_conditional=[
{
'if': {
'column_id': 'score',
'filter_query': '{score} gt 50'
},
'backgroundColor': '#3D9970',
'color': 'white',
}
,{
'if': {
'column_id': 'score',
'filter_query': '{score} lt 10'
},
'backgroundColor': '#B20000',
'color': 'white',
}
,{
'if': {
'column_id': 'comments',
'filter_query': '{comments} gt 45'},
'backgroundColor': '#3D9970',
'color': 'white',
}
,{
'if': {
'column_id': 'comments',
'filter_query': '{comments} lt 20'},
'backgroundColor': '#B20000',
'color': 'white',
}
,{
'if': {
'column_id': 'unique density',
'filter_query': '{unique density} lt 0.7'},
'backgroundColor': '#3D9970',
'color': 'white',
}
]
,columns=[{"name": i, "id": i} for i in df.columns]
,fixed_rows={ 'headers': True, 'data': 0 }
,data=df.to_dict('records')
)
])
@app.callback(Output('table', 'data'),
              [Input('refresh', 'n_clicks')],
              [State('input-1-state', 'value')
               ])
def update_data(n_clicks, subreddits):
    dff = df
    if subreddits is None:
        subreddits = 'wallstreetbets'
    else:
        subreddits
    if n_clicks is None:
        raise PreventUpdate
    else:
        posts = []
        new_bets = reddit.subreddit(subreddits).new(limit=100)
        for post in new_bets:
            posts.append([post.title, post.score, post.num_comments, post.selftext, post.created, post.pinned, post.total_awards_received])
        posts = pd.DataFrame(posts,columns=['title', 'score', 'comments', 'post', 'created', 'pinned', 'total awards'])
dff = posts.copy()
dff['words'] = dff['post'].apply(lambda x : len(x.split()))
dff['chars'] = dff['post'].apply(lambda x : len(x.replace(" ","")))
dff['word density'] = (dff['words'] / (dff['chars'] + 1)).round(3)
dff['unique words'] = dff['post'].apply(lambda x: len(set(w for w in x.split())))
dff['unique density'] = (dff['unique words'] / dff['words']).round(3)
return dff.to_dict('records')if __name__ == '__main__':
app.run_server(debug=True, port = 8050)Thank You!
- If you enjoyed this, follow me on Medium for more
- Get FULL ACCESS and help support my content by subscribing
- Let’s connect on LinkedIn
- Analyze Data using Python? Check out my website


