
Dashboards in Python for Beginners using Dash — Responsive Mobile Dashboards with Bootstrap CSS Components
Examples of Bootstrap Components for Responsive Dashboards

Why Responsive Design
Mobile browsing is huge, accounting for roughly half of web traffic worldwide, and will likely remain one of the fastest growing ways to consume web media. Since mobile browsing is prevalent, it is important to understand whether the users of your dashboards will need a responsive design. For example, at my job, I design dashboards for business people that travel and interact with customers. I need to make sure the visualizations and navigation won’t break down if my users need to display the data from their phone or tablet.
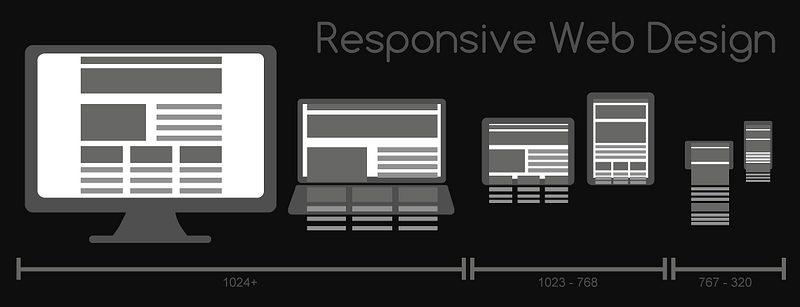
Although I know enough CSS to style a simple website, I find creating style sheets a little tedious. Dash makes it easy to apply your own style sheets if you’re capable of creating them; however, if you’re unfamiliar with CSS or don’t want to take the time to create your own, Dash can utilize Bootstrap CSS which makes styling and page-layout extremely easy to piece together. Bootstrap is one of the worlds most popular front-end frameworks for creating responsive, mobile friendly sites.
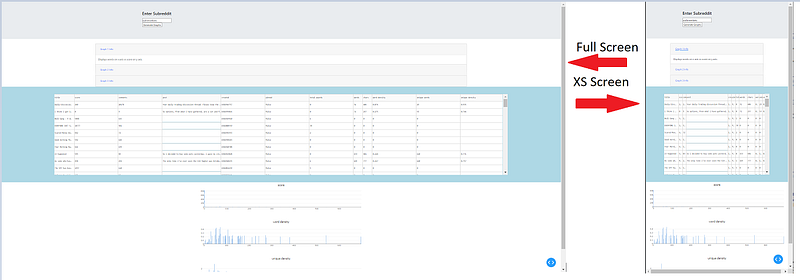
Getting into CSS and Dash
In this article, I’ll discuss the foundation of the Bootstrap CSS Grid layout, and look at some interesting dash-bootstrap-components and callbacks like the Accordion, Modal and Jumbotron.
Dash is a framework for Python written on top of Flask, Plotly.js, and React.js. Dash apps are composed of Layouts and Callbacks:
Layout
The layout is made up of a tree of components that describe what the application looks like and how users experience the content.
Callbacks
Callbacks make the Dash apps interactive. Callbacks are Python functions that are automatically called whenever an input property changes.
If you’re unfamiliar with Dash or need a quick refresher, please check out my introduction articles. All code is available at the end of the article!
What is CSS?
Cascading style sheets, or CSS, are typically external files that can describe how HTML elements in your website are displayed on devices. Style sheets are useful because they can influence multiple pages all at once, thus saving a lot of time and effort if there are several pages in the website. CSS allows me to essentially define the style of my dashboards, and it affects the layout on different screen sizes.
In a traditional CSS file, you would see some syntax like this describing how HTML elements should appear:
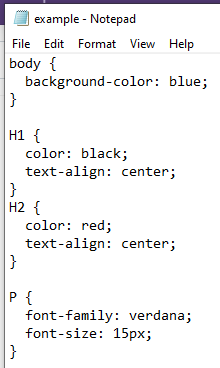
Notice how the style sheet is describing the style and colors for the H1, H2, and P HTML tags. Style sheets can be imported into Dash.
Bootstrap CSS in Dash
Similar to how the dash-html-components library allows you to apply HTML using Python, the dash-bootstrap-components library allows you to apply Bootstraps front-end components that are affected by the Bootstrap CSS framework. To quote the documentation:
dash-bootstrap-components relies on Twitter Bootstrap. To use this package, inject the Bootstrap stylesheet into your application. For convenience, links to Bootstrap CSS hosted on bootstrapcdn are included as part of the
themesmodule
To configure the app to run using the Bootstrap CSS, you’ll need to include this bit of boilerplate code. Notice this is where the external stylesheet is set. Since I am using Bootstrap CSS, I set it using [dbc.themes.BOOTSTRAP].
app = dash.Dash(__name__, external_stylesheets =[dbc.themes.BOOTSTRAP])Installation and Dependencies
Install dash-bootstrap-components easily using pip or Anaconda:
pip install dash-bootstrap-componentsORconda install -c conda-forge dash-bootstrap-componentsWhen importing dependencies, include the dash_bootstrap_components library and alias it as dbc.
import dashimport dash_bootstrap_components as dbcimport dash_core_components as dcc
import dash_html_components as htmlExploring Bootstrap Layout Components
In my opinion, the Layout Components are the biggest benefit of using the library, but I’ll show off a few other cool components after reviewing the grid.
The responsive grid system and the convenient container wrappers allow for a lot of customization. Bootstrap’s grid system uses a series of containers, rows, and columns to layout and align content. Those have been included as components in dash-bootstrap-components library as Container, Row, and Col.
The
Rowcomponent is a wrapper for columns. The layout of your app should be built as a series of rows of columns.
When using the grid layout, content should be placed in columns, and only
Colcomponents should be immediate children ofRow.
The Bootstrap grid contains 12 columns and five tiers of responsiveness. It is easy to visualize the columns using the dbc.Alert() component.
import dash
import dash_bootstrap_components as dbc
import dash_core_components as dcc
import dash_html_components as htmlapp = dash.Dash(__name__, external_stylesheets=[dbc.themes.BOOTSTRAP])body = html.Div([
html.H1("Bootstrap Grid System Example")
, dbc.Row(dbc.Col(html.Div(dbc.Alert("This is one column", color="primary"))))
, dbc.Row([
dbc.Col(html.Div(dbc.Alert("One of three columns", color="primary")))
, dbc.Col(html.Div(dbc.Alert("One of three columns", color="primary")))
, dbc.Col(html.Div(dbc.Alert("One of three columns", color="primary")))
])
])app.layout = html.Div([body])if __name__ == "__main__":
app.run_server(debug = True)Notice the body is built using a series of Rows and Columns like the documentation suggests. Notice dbc.Col is the immediate child of dbc.Row, but dbc.Col is followed by familiar Dash HTML components.
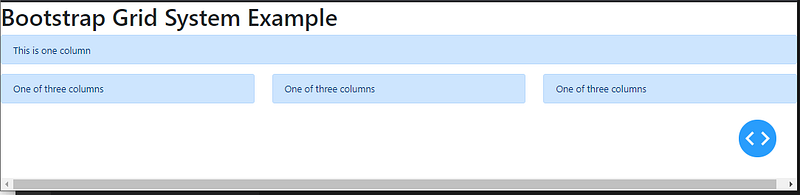
By default, the column will expand to take the entire screen. To have more control over how the columns expand, try wrapping the grid in a dbc.Container or use the width argument to assign a width to the column.
Notice the columns have a gap in between them. The spaces are called Gutters and are a part of the dbc.Row component. To remove the gutters set no_gutters = True.
Below is a more extensive example of how the grid can be styled. Since the rows make up 12 columns, it is easiest to use numbers that factor 12 when working with multiple columns in a row. As seen in the example, I use several combinations of column sizes.
body = html.Div([html.H1("Bootstrap Grid System Example")
, html.H4("no_gutters = False")
, dbc.Row([
    dbc.Col(html.Div(dbc.Alert("One of two columns")), width=3),
    dbc.Col(html.Div(dbc.Alert("One of two columns")), width=3),
    dbc.Col(html.Div(dbc.Alert("One of two columns")), width=3),
    dbc.Col(html.Div(dbc.Alert("One of two columns")), width=3)
])
, html.H4("no_gutters = True")
, dbc.Row([
    dbc.Col(html.Div(dbc.Alert("One of two columns")), width=3),
    dbc.Col(html.Div(dbc.Alert("One of two columns")), width=3),
    dbc.Col(html.Div(dbc.Alert("One of two columns")), width=3),
    dbc.Col(html.Div(dbc.Alert("One of two columns")), width=3)
], no_gutters = True)
, html.H3("Examples of justify property")
, html.H4("start, center, end, between, around")
, dbc.Row([
    dbc.Col(html.Div(dbc.Alert("One of two columns")), width=4),
    dbc.Col(html.Div(dbc.Alert("One of two columns")), width=4),
],
justify="start")
, dbc.Row([
    dbc.Col(html.Div(dbc.Alert("One of two columns")), width=3),
    dbc.Col(html.Div(dbc.Alert("One of two columns")), width=3),
],
justify="center")
, dbc.Row([
    dbc.Col(html.Div(dbc.Alert("One of three columns")), width=3)
    , dbc.Col(html.Div(dbc.Alert("One of three columns")), width=3)
    , dbc.Col(html.Div(dbc.Alert("One of three columns")), width=3)
],
justify="end")
, dbc.Row([
    dbc.Col(html.Div(dbc.Alert("One of two columns")), width=3),
    dbc.Col(html.Div(dbc.Alert("One of two columns")), width=3)
    , dbc.Col(html.Div(dbc.Alert("One of three columns")), width=3)
],
justify="between")
, dbc.Row([
    dbc.Col(html.Div(dbc.Alert("One of two columns")), width=4),
    dbc.Col(html.Div(dbc.Alert("One of two columns")), width=4),
],
justify="around")
, html.H4("Container Example")
, dbc.Container([
    dbc.Row([
    dbc.Col(html.Div(dbc.Alert("One of two columns")), width=3),
    dbc.Col(html.Div(dbc.Alert("One of two columns")), width=3),
    dbc.Col(html.Div(dbc.Alert("One of two columns")), width=3),
    dbc.Col(html.Div(dbc.Alert("One of two columns")), width=3)
])
, html.H4("no_gutters = True")
, dbc.Row([
dbc.Col(html.Div(dbc.Alert("One of two columns")), width=3),
dbc.Col(html.Div(dbc.Alert("One of two columns")), width=3),
dbc.Col(html.Div(dbc.Alert("One of two columns")), width=3),
dbc.Col(html.Div(dbc.Alert("One of two columns")), width=3)
], no_gutters = True)
])
])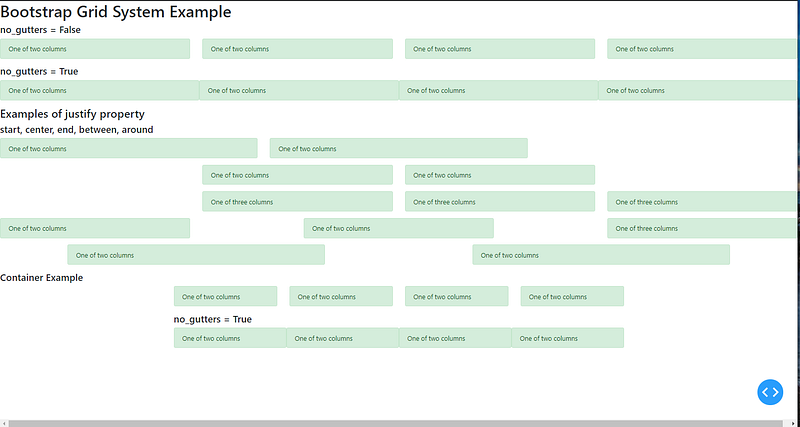
Notice the gutters can be easily removed, and Rows can be justified. Notice how the container example centers and shrinks the columns by default.
In addition to using the width argument, customize the size, order and offset of your columns on a variety of devices using the xs, sm, md, lg, and xl keyword arguments.
body = html.Div([
html.H1("Bootstrap Grid System Example")
, dbc.Row(dbc.Col(html.Div(dbc.Alert("This is one column", color="primary"))))
, dbc.Row([
        dbc.Col(html.Div(dbc.Alert("One of three columns", color="primary")), lg=3, md=4, xs=12)
        , dbc.Col(html.Div(dbc.Alert("One of three columns", color="primary")), lg=3, md=4, xs=12)
        , dbc.Col(html.Div(dbc.Alert("One of three columns", color="primary")), lg=3, md=4, xs=12)
        ])
    ])

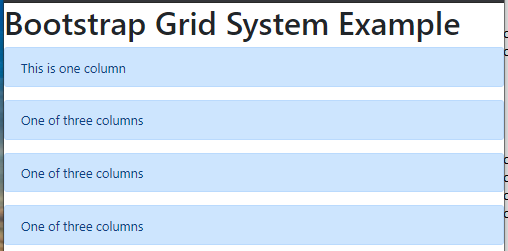
Notice the column size changes as the screens get smaller. For example, using xs = 12 causes the column to consume the entire row when the screen is extra small since a the grid system is composed of 12 columns.
That, in a nutshell, is the simplicity and power of the Bootstrap responsive grid system. In a few lines of code, it is possible to create a responsive layout that will work on a variety of screen sizes. It is easy to apply the grid to existing dashboards.
Enhancing a Dashboard
In a previous article, I explain how to pull data from Reddit and display it using the Data Table component library in Dash. To give more realistic examples of applying Bootstrap components, I’ll apply them to the Reddit dashboard. If you’re already familiar with Reddit, I include all of the starter code below in this article; otherwise, refer to the previous article for instructions on generating Reddit API keys!

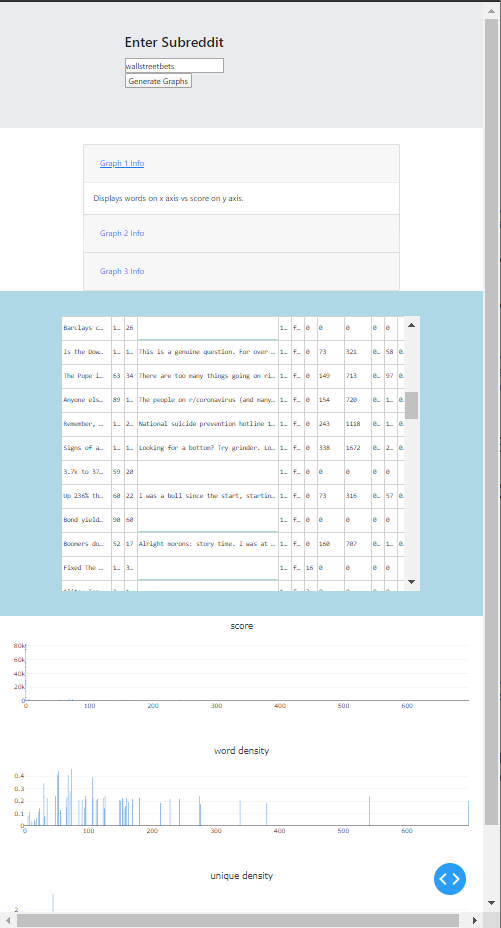
I’ll explain how I turn the original Reddit Dashboard into the image below using Bootstrap CSS. I’ll add a Jumbotron, a Collapse Accordion, and a Modal that generates a popup when the Generate Graphs button is pushed:
Starter Code
This is starter code that will provide you with the core Reddit dashboard. It assumes you are using a config file to pass the API keys into the code. It defaults to the subreddit wallstreetbets, so update that value if you’d like it to default to a different one.
import dash
import dash_html_components as html
import dash_core_components as dcc
import dash_table
import pandas as pd
import praw
import pandas as pd
from dash.dependencies import Input, Output, State
from dash.exceptions import PreventUpdate
from config import cid, csec, uag
reddit = praw.Reddit(client_id= cid, client_secret= csec, user_agent= uag)posts = []new_bets = reddit.subreddit('wallstreetbets').new(limit=100)for post in new_bets:
posts.append([post.title, post.score, post.num_comments, post.selftext, post.created, post.pinned, post.total_awards_received])
posts = pd.DataFrame(posts,columns=['title', 'score', 'comments', 'post', 'created', 'pinned', 'total awards'])def get_features(dataframe):
df = posts.copy()df['words'] = df['post'].apply(lambda x : len(x.split()))
df['chars'] = df['post'].apply(lambda x : len(x.replace(" ","")))
df['word density'] = (df['words'] / (df['chars'] + 1)).round(3)
df['unique words'] = df['post'].apply(lambda x: len(set(w for w in x.split())))
df['unique density'] = (df['unique words'] / df['words']).round(3)return dfdf = get_features(posts)app.layout = html.Div([
html.P(html.Button('Refresh', id='refresh'))
,html.P(html.Div(html.H3('Enter Subreddit')))
,dcc.Input(id='input-1-state', type='text', value='wallstreetbets')
,dash_table.DataTable(
id='table'
,columns=[{"name": i, "id": i} for i in df.columns]
,fixed_rows={ 'headers': True, 'data': 0 }
,data=df.to_dict('records')
)
])@app.callback(Output('table', 'data'),
[Input('refresh', 'n_clicks')],
[State('input-1-state', 'value')
])
def update_data(n_clicks, subreddits):
dff = df
if subreddits is None:
subreddits = 'wallstreetbets'
else:
subreddits
if n_clicks is None:
raise PreventUpdate
else:
posts = []
new_bets = reddit.subreddit(subreddits).hot(limit=100)
for post in new_bets:
    posts.append([post.title, post.score, post.num_comments, post.selftext, post.created, post.pinned, post.total_awards_received])
posts = pd.DataFrame(posts,columns=['title', 'score', 'comments', 'post', 'created', 'pinned', 'total awards'])
dff = get_features(posts)
return dff.to_dict('records')Adding Jumbotron
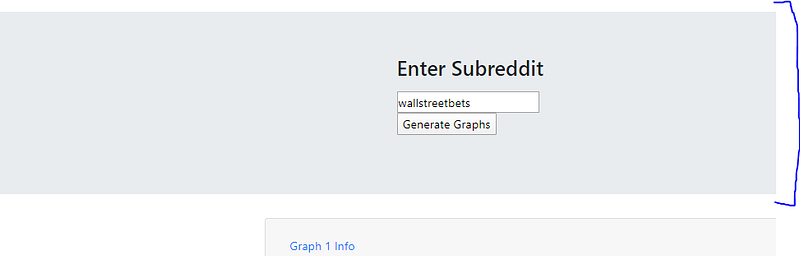
A Jumbotron is a lightweight component that helps content stand out. It takes up a lot of space on the screen which makes it great for showcasing buttons and messages. The Jumbotron is this big gray box surrounding the input field and button.
Here is the section of code being adjusted for the Bootstrap component:
# Original
html.Div([
    html.P(html.Button('Refresh', id='refresh'))
    ,html.P(html.Div(html.H3('Enter Subreddit')))
    ,dcc.Input(id='input-1-state', type='text', value='wallstreetbets')
])
I will use dbc.Jumbotron to wrap the html.Div that contains the input and button components. The bold code is what has wrapped the original code.
dbc.Jumbotron([
dbc.Row(dbc.Col([
html.P(html.Div(html.H3('Enter Subreddit')))
, dcc.Input(id='input-1-state', type='text', value='wallstreetbets')
, html.P(html.Button('Generate Graphs', id='refresh'))
   ], width = 6)
  , justify = 'center')# end row
  ], fluid = True)
Notice the dbc.Jumbotron wraps dbc.Row and dbc.Col so I can take advantage of the width and justify arguments. Notice I justify the content to the center to make it easier to notice. Notice I set the fluid= True argument for the Jumbotron. A fluid jumbotron will be full width and has square corners.
Adding Modal
Modals are another useful tool for drawing attention to messages or features. Use the dbc.Modal component to add user notifications or custom content that pops up after the user performs an action. For example, when a user clicks the Generate Graphs button, Modal produces a popup that lets the user know the graphs have been generated.
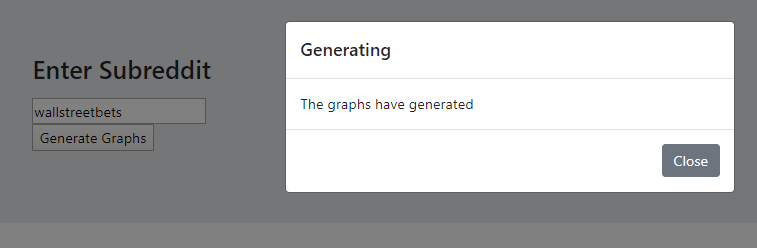
The Modal is being placed within the Jumbotron. I put it there since it interacts with the button.
dbc.Jumbotron([
dbc.Row(dbc.Col([
html.P(html.Div(html.H3('Enter Subreddit')))
, dcc.Input(id='input-1-state', type='text', value='wallstreetbets')
, html.P(html.Button('Generate Graphs', id='refresh'))
, dbc.Modal(
     [
   dbc.ModalHeader("Generating"),
   dbc.ModalBody("The graphs have generated"),
   dbc.ModalFooter(
      dbc.Button("Close", id="close", className="ml-auto")
      ),
      ],
      id="modal",
    )
   ], width = 6)
  , justify = 'center')# end row
  ], fluid = True)
Notice the Modal is constructed using a Header, Body and Footer component. By default, the Modal can be dismissed by clicking outside the modal or by pressing the escape key.
It is possible to adjust the size of the Modal using the size property. The options are sm, lg, or xl for a small, large or extra large Modal.
In order to function, the Modal uses a callback. Using callbacks, it is possible to set the is_open property to True or False, depending on how I want it to display.
@app.callback(
    Output("modal", "is_open"),
    [Input("open", "n_clicks"), Input("close", "n_clicks")],
    [State("modal", "is_open")],
)
def toggle_modal(n1, n2, is_open):
    if n1 or n2:
        return not is_open
    return is_open
Adding Accordion with Collapse
By using the dbc.Collapse component, it is possible to toggle the visibility of content. By combining the Collapse and the Card component, you can extend the default collapse behavior to create an accordion.
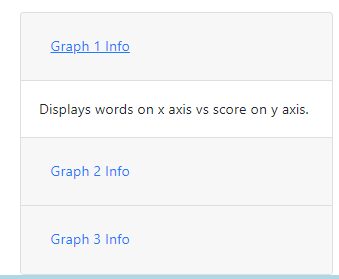
Creating an Accordion is tricky because Dash will throw an error if components have the same ID. Thus, using a function, I can programmatically create unique IDs for the Collapse and Card components in the accordion. This also makes populating the Cards in the accordion a bit difficult, but I use a list in the function to simplify the population logic!
def make_item(i):
    # we use this function to make the example items to avoid code duplication
    graph_info = [0,'Displays words on x axis vs score on y axis.'
                    , 'Displays words on x axis vs word density on y axis.'
                    , 'Displays words on x axis vs unique density on y axis.']
    return dbc.Card(
        [
            dbc.CardHeader(
                html.H2(
                    dbc.Button(
                        f"Graph {i} Info",
                        color="link",
                        id=f"group-{i}-toggle",
                    )
                )
            ),
            dbc.Collapse(
                dbc.CardBody(graph_info[i]),
                id=f"collapse-{i}",
            ),
        ]
    )
The function make_item(i) takes in a numeric value and outputs a dbc.Card component that wraps the Collapse used to create the accordion effect. Notice the list graph_info. It is the list I use to populate the contents of the dbc.CardBody since I can pass the corresponding numeric value to the index of the list. For example, if I pass 1 into make_item(1), I will return the value at index 1 in my list graph_info. The item in index one is this:
Displays words on x axis vs score on y axis.Constructing the Accordion
To construct the accordion, I call the functions and wrap them in an html.Div component.
accordion = html.Div([make_item(1), make_item(2), make_item(3)], className="accordion")I add it to the main html.Div list between the jumbotron and the data table.
Accordion Callback
I took the boilerplate callback from the documentation. Depending on the number of cards in the accordion, increase the range for the Output, Input and State.
@app.callback(
    [Output(f"collapse-{i}", "is_open") for i in range(1, 4)],
    [Input(f"group-{i}-toggle", "n_clicks") for i in range(1, 4)],
    [State(f"collapse-{i}", "is_open") for i in range(1, 4)],
)
def toggle_accordion(n1, n2, n3, is_open1, is_open2, is_open3):
    ctx = dash.callback_context
if not ctx.triggered:
return ""
else:
button_id = ctx.triggered[0]["prop_id"].split(".")[0]if button_id == "group-1-toggle" and n1:
return not is_open1, False, False
elif button_id == "group-2-toggle" and n2:
return False, not is_open2, False
elif button_id == "group-3-toggle" and n3:
return False, False, not is_open3
return False, False, FalseThe Complete Dashboard
After completing the dashboard, it is easy to see how Bootstrap CSS for Dash is a powerful component library that makes it easy to format content for mobile browsing. I walked through the Responsive Grid, Jumbotron, Collapse, and Modal components to showcase some of the more advanced ways the Bootstrap component library can enhance a dashboard’s usability. Below is the complete code for the dashboard. Check out my other tutorials if you’re new to coding or data science too!
Thank You!
- If you enjoyed this, follow me on Medium for more
- Get FULL ACCESS and help support my content by subscribing
- Let’s connect on LinkedIn
- Analyze Data using Python? Check out my website
The Code
Here is the complete code. Remember, it assumes you are using a config file to import the API keys.
import dash
import dash_html_components as html
import dash_core_components as dcc
import dash_table
import pandas as pd
import praw
import pandas as pd
from dash.dependencies import Input, Output, State
from dash.exceptions import PreventUpdate
from config import cid, csec, uag
reddit = praw.Reddit(client_id= cid, client_secret= csec, user_agent= uag)posts = []new_bets = reddit.subreddit('wallstreetbets').hot(limit=100)for post in new_bets:
posts.append([post.title, post.score
, post.num_comments, post.selftext
, post.created, post.pinned, post.total_awards_received])
posts = pd.DataFrame(posts,columns=['title', 'score', 'comments', 'post', 'created', 'pinned', 'total awards'])def get_features(dataframe):
df = posts.copy()df['words'] = df['post'].apply(lambda x : len(x.split()))
df['chars'] = df['post'].apply(lambda x : len(x.replace(" ","")))
df['word density'] = (df['words'] / (df['chars'] + 1)).round(3)
df['unique words'] = df['post'].apply(lambda x: len(set(w for w in x.split())))
df['unique density'] = (df['unique words'] / df['words']).round(3)return dfdf = get_features(posts)def make_item(i):
# we use this function to make the example items to avoid code duplication
graph_info = [0,'Displays words on x axis vs score on y axis.'
, 'Displays words on x axis vs word density on y axis.'
, 'Displays words on x axis vs unique density on y axis.']
return dbc.Card(
[
dbc.CardHeader(
html.H2(
dbc.Button(
f"Graph {i} Info",
color="link",
id=f"group-{i}-toggle",
)
)
),
dbc.Collapse(
dbc.CardBody(graph_info[i]),
id=f"collapse-{i}",
),
]
)accordion = html.Div(
[make_item(1), make_item(2), make_item(3)], className="accordion"
)app = dash.Dash(__name__, external_stylesheets=[dbc.themes.BOOTSTRAP])app.layout = html.Div([dbc.Jumbotron([dbc.Row(dbc.Col([
html.P(html.Div(html.H3('Enter Subreddit')))
, dcc.Input(id='input-1-state', type='text', value='wallstreetbets')
, html.P(html.Button('Generate Graphs', id='refresh'))
, dbc.Modal(
[
dbc.ModalHeader("Generating"),
dbc.ModalBody("The graphs have generated"),
dbc.ModalFooter(
dbc.Button("Close", id="close", className="ml-auto")
),
],
id="modal",
)
], width = 6)
, justify = 'center')# end row
], fluid = True)
, html.Div(dbc.Row(dbc.Col(accordion ,width = 8),justify = 'center'))
, html.Div([
dbc.Row(dbc.Col(dash_table.DataTable(
id='table'
, columns=[{"name": i, "id": i} for i in df.columns]
, data=df.to_dict('records')
#, fixed_rows={ 'headers': True, 'data': 0 }
, style_cell_conditional=[
{'if': {'column_id': 'title'},
'width': '150px'
,'padding': '15px'},
{'if': {'column_id': 'post'},
'width': '400px'
}
,{'if': {'column_id': 'words'},
'width': '65px'
}
,{'if': {'column_id': 'chars'},
'width': '65px'
}
]
,style_cell={
'overflowX': 'hidden',
'textOverflow': 'ellipsis',
'maxWidth': '25px',
'textAlign': 'left'
}
, style_table={
'maxHeight': '550px'
#,'maxWidth': '800px'
,'overflowY': 'scroll'
,'overflowX': 'hidden'
}), width = 10), justify = 'center')# end dt
], style = {'background-color': 'lightblue'
#,'margin-bottom': '5px'
, 'padding' : '50px'
}) #end div, dbc.Container(
html.Div(id = 'graph-container')
)])#end div@app.callback(
[Output(f"collapse-{i}", "is_open") for i in range(1, 4)],
[Input(f"group-{i}-toggle", "n_clicks") for i in range(1, 4)],
[State(f"collapse-{i}", "is_open") for i in range(1, 4)],
)
def toggle_accordion(n1, n2, n3, is_open1, is_open2, is_open3):
ctx = dash.callback_contextif not ctx.triggered:
return ""
else:
button_id = ctx.triggered[0]["prop_id"].split(".")[0]if button_id == "group-1-toggle" and n1:
return not is_open1, False, False
elif button_id == "group-2-toggle" and n2:
return False, not is_open2, False
elif button_id == "group-3-toggle" and n3:
return False, False, not is_open3
return False, False, False@app.callback(
Output("modal", "is_open"),
[Input("refresh", "n_clicks"), Input("close", "n_clicks")],
[State("modal", "is_open")],
)
def toggle_modal(n1, n2, is_open):
if n1 or n2:
return not is_open
return is_open@app.callback(
Output('graph-container', "children"),
[Input('table', "data")])
def update_graph(rows):
dff = pd.DataFrame(rows)
return html.Div(
[
dcc.Graph(
id=column,
figure={
"data": [
{
"x": dff["words"],
"y": dff[column] if column in dff else [],
"type": "bar",
"marker": {"color": "#0074D9"},
}
],
"layout": {
"xaxis": {"automargin": True},
"yaxis": {"automargin": True},
"height": 250,
"margin": {"t": 50, "l": 10, "r": 10},
"title": column
},
},
)
for column in ["score", "word density", "unique density"]
]
)@app.callback(Output('table', 'data'),
[Input('refresh', 'n_clicks')],
[State('input-1-state', 'value')
])
def update_data(n_clicks, subreddits):
dff = df
if subreddits is None:
subreddits = 'wallstreetbets'
else:
subreddits
if n_clicks is None:
raise PreventUpdate
else:
posts = []
new_bets = reddit.subreddit(subreddits).hot(limit=100)
for post in new_bets:
posts.append([post.title, post.score, post.num_comments, post.selftext, post.created, post.pinned, post.total_awards_received])
posts = pd.DataFrame(posts,columns=['title', 'score', 'comments', 'post', 'created', 'pinned', 'total awards'])
dff = get_features(posts)
return dff.to_dict('records')if __name__ == '__main__':
app.run_server(debug=True)


