
Similar analyses could be helpful for you
2021: stories on these topics performed the best
Writing on some quite disparate topics, and reaching a total of almost 200 stories in this (my first) year, allowed me to compare what topics performed best while keeping various parameters constant. Read on to discover several interesting results, some expected but others surprising. And perhaps get inspired to analyze your own stories.
Jump to: Introduction / Data compilation / Qualitative analysis: What do my readers like from my stories? / Number crunching to connect all variables and understand income
As my frontpage and welcome page explain I call this place @lucianosphere because I write about everything that lies within my broad range of interests. One day I may write an outreach story about some cool new piece of scientific research; another day I might be telling you a story centered around photography on some special topic; then I might be showing you how to do something cool with programming or I might be telling you a short story, or describing my experience trying out some new piece of tech, or showing you how my garden is going or how my latest hike went. Or something else, like telling you the stories of hidden talents and artists or reflecting on seemingly mundane things. Or, again, something else. As an old supervisor said, I’m very eclectic.
Almost reaching 200 published stories as of today, I’m running deep analyses on the statistics of my content, including the basic stats provided by the platform and also additional parameters I’ve added. The point of this is to learn more about the platform, my readers, and how my writing works, and thus help myself decide where to go next -and why not inspire you to analyze your own data, too! For the moment, here goes my first analysis, that will be followed by one or two additional articles. This first article explores (and reveals several interesting points about) what readers like to consume, what features of the articles generate higher income, and how other things work around here. Future articles will look into more detail at the evolution of my content and reader engagement over time.
Data compilation
To keep it simple for the moment, I extracted for all my stories the few parameters provided by the system under “Stats”: number of views, of reads, of fans, and read/view ratios; plus Income and Story length (minutes) extracted one by one for each story. I also labeled each story with a category flag. Note that the “category” flags I applied are rather broad. For example, “data science” includes articles mixing true data analysis with some programming, technologies, cryptocurrencies, etc. Likewise, “photography” includes stories truly centered on photography and others that actually treat hiking, nature, flowers, art, gardening… all with an important component of photography. I had to do so because my content is barely clear-cut… for example, a lot of data analysis requires programming, some photography articles actually deal with science communication, etc.
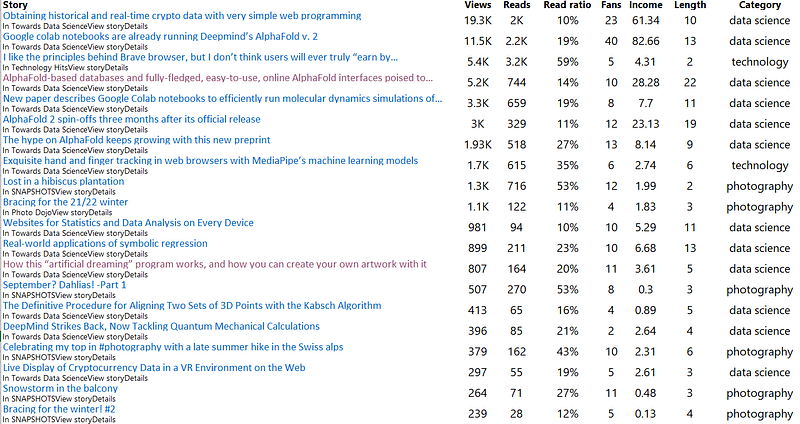
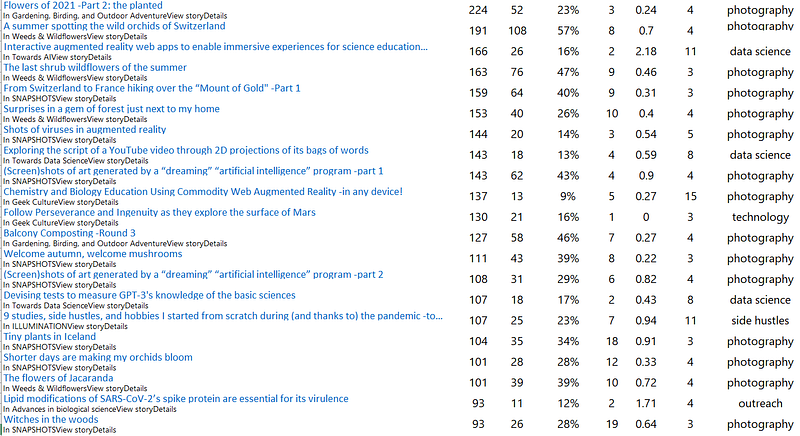
I compiled all this information for the top 40+ stories as ranked by number of views. The information in tabular format looks like this (rolled out in two figures for clarity):
Qualitative analysis: What do my readers like from my stories?
An obvious pattern shows up: articles about data science, programming, etc. dominate at the top. Some of them actually went “viral” (by my standards, I mean) resulting in transient high peaks within a more stable baseline (analyzed below in a separate section). One special case is the article about the Brave browser (which I categorized as “technology”) which ranks 3rd by number of views despite being very new -just two weeks old vs. 5 and 3 months old for the articles ranking first and second. Notice however that the income I got from the article on Brave is low and not at all proportional to the top two articles by any metric considered. The problem with the Brave article, I think, is that 94% of its reads are external!
Now, as you see there are some articles that have lots of views but are not read much, or that do not have many reads yet have many fans and/or produced better income than others, etc. Although a deep analysis would involve knowing how the algorithm works as well as the full reading time by members and non-members (which is somewhere there but takes time to extract for each story) I think there’s some relevant information for us writers in the numbers I did compile. I won’t go into much detail or do further data scrapping work because I’m not here to reverse-engineer the algorithm that decides payments. I’m here just out of genuine curiosity, to determine what my readers like to read among all the things I publish, and which of the topics I write about generate better income -pragmatically and regardless of how the algorithm determines that.
Best performing topic
Back to the analysis, clearly the articles that performed best are those that touch on topics about programming and data sciences, especially those accepted in Towards Data Science which has around 600k readers. Note that not all articles I submitted to that publication got accepted. And this is good, because it means somebody is critically reading the articles before they are published. These publications are reaching the 2-digit incomes that make up most of my gain in the platform, which is around the 30–50 USD/month mark. Yes I know, not much if you want to live from that income. But not bad if it is just -at least for the moment- a fun side hustle. I’m doing this only as a side hustle, only when time permits and only on topics I care about. I guess I could make more if I dedicated more time and effort and if I gained more readers. (I wonder what big writers like Anne Bonfert think about all this.) And clearly, from the analysis above, if I focused more on the kinds of articles that fall into “data science”.
Second best performing topic
The second set of successful stories is that around the niche of photography, or rather photo-stories where the text has the main role of providing the frame, layout and flow for a story that is told mainly through photographs. Honestly, I discovered this amusement in telling photostories by chance. I initiated myself in the platform by posting stories about my gardens and hikes, barely decorated with photos, and eventually found myself creating material that consists mainly of photographs. Thanks Dennett for many tips when I was starting, and again herself plus many others like Anne Bonfert, Sherry Kappel, David Acaster, Inge E. Knudsen, Pene Hodge, Patsy Collins, Dan Pfeifer, Jane Frost (Jane Grows Garden Rooms), Randy Runtsch (and possibly other names that don’t come to my mind right now, sorry!) for inspiration as I read their articles. I could give to some of my photostories special twists that some readers appreciated, such as playing with immersive 360 degree photography, shooting virtual objects onto camera feeds by using augmented reality, connecting colors, art and photography with science and programming, etc. In a few occasions I’ve participated in some interesting challenges like the one about shooting up to the ski, which turned out quite successful.
All this said, these photostories have brought just single-digit sums every month, -and I mean this adding all of them together! As you can see in the tables above, many of these photostories have produced just cents to a few USD in their whole lives, even with hundreds of views, good read ratios and many claps. Besides, usually for a given month the income contribution from photostories is dominated by just 1 or 2 stories making the biggest contribution (to a totally single-digit number) while the other stories contribute cents each. And the bigger contribution by 1 or 2 stories usually involves stories published in the same month for which I’m receiving the payment. This means that, although the stories are liked and read, the views are not much sustained in time beyond their publication date. Even when they are “Distributed” -and I’ve had several distributed stories, also in photography!
Beyond writing
Strictly speaking, the actual income *generated* by some articles might even go beyond what one gets paid for reading time. For example, some stories put me in contact with people interested in proposing jobs. I accepted some of them and unfortunately had to reject others that were too time-consuming for a side hustle. Especially fruitful were the articles on cryptocurrencies, that resulted in three completed jobs about grabbing data from online sources.
Number crunching to connect numbers of views, number of reads, numbers of fans, read ratio, article length, and income
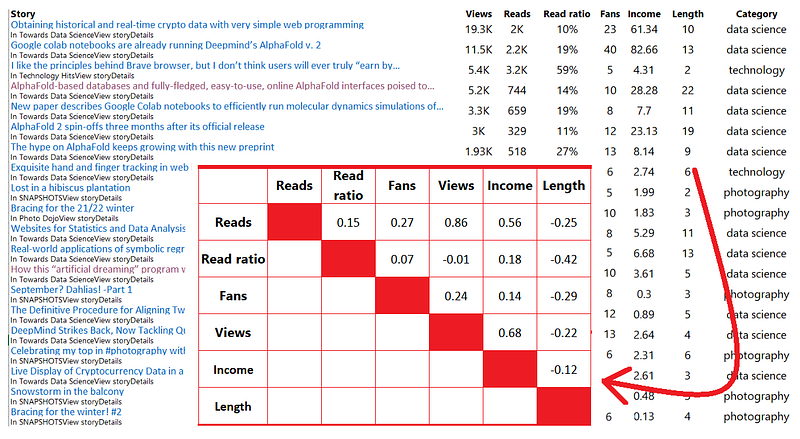
Can we learn something else from the data I compiled above? This correlation table computed from the 40+ entries above might have some hints:
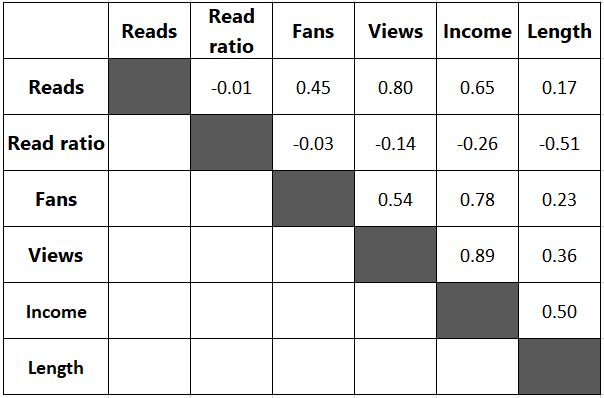
Some conclusions are straightforward: The total number of views correlates with Income (r=0.89), but number of reads and number of fans correlate well and nearly as well as number of views (r=0.65 and r=0.78). It makes sense that you need more actual reads (by members) and more fans to make more income. But of course they cannot come alone, so you need large numbers of views. I guess this is especially important if your read ratio is low, as it is for most of my stories: more total viewers increase the number of “viewers that end up contributing” at a given read ratio. That number of fans and number of reads correlate quite well means that content is actually valued by the platform, and this is great.
Note that the read ratio doesn't seem to correlate with number of fans, number of views, or income (well maybe a bit with income). But it does correlate, and negatively, with article length. This makes perfect sense with Dennett’s suggestion about keeping articles short, at least for photostories. Note that the correlation between Length and Income is positive, but this is probably because the most “valued” stories are those about data science, programming, etc., which are often lengthy. On re-computing that same correlation only for photostories the correlation drops from 0.5 to nearly 0.
Space for discussion
What do you think about all these analysis, fellow writer and creator? On reflecting about it please take into account that right now I have just passed the 300 followers, and that when I published my first stories I had just 0. So, obviously, my first stories were not as exposed as my last stories; and even my last stories may not be comparable in exposure to the thousands of followers that you might have.
Evolution of statistics over time will be, quite probably, the topic of my next analysis of 2021 stories. Stay tuned!