
NVIDIA FY23 Q4 Earning Report via Sankey Chart & MA Analysis

How to Use Sankey Chart to report business earnings via Python Plotly?
Disney FY24 Q1
AMD FY23 Q4
Delta Electronics FY23 Q3
Dollar General FY23 Q3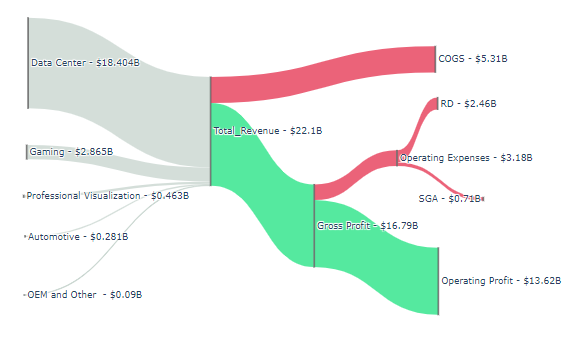
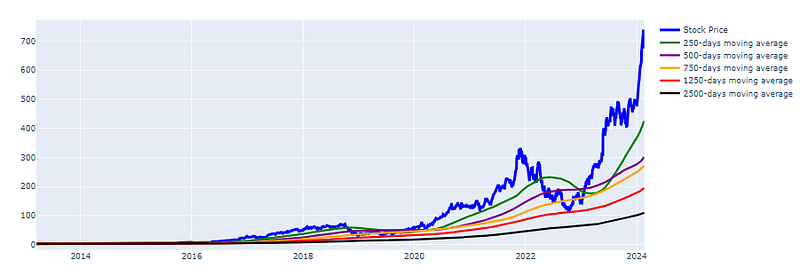
How to Create X-days Moving Average Chart in stock market via Python (Plotly & Pandas)
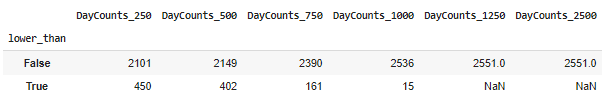
The below table is showing how many days the stock price drops below the moving average after 2014.
Thank you!
If you want to support Informula, you can buy us a coffee here :)


