Where Are the Packets Captured by Suricata on pfSense?
Show me the packets!
~~~~~~~~~~~~~~~~~~~~~~~~~~~~~~~~~~~~~~~~~~~~~~~~~~~~~~~
⚙️ Check out my series on Automating Cybersecurity Metrics | Code.
🔒 Related Stories: Network Security | pfSense | Cybersecurity
💻 Free Content on Jobs in Cybersecurity | ✉️ Sign up for the Email List
~~~~~~~~~~~~~~~~~~~~~~~~~~~~~~~~~~~~~~~~~~~~~~~~~~~~~~~
I’ve been writing about Suricata on pfSense for a minute. In the last post I dug into why the stream rules don’t work for Suricata on pfSense.
In this post, I want to look at the individual network packets that triggered the alerts.
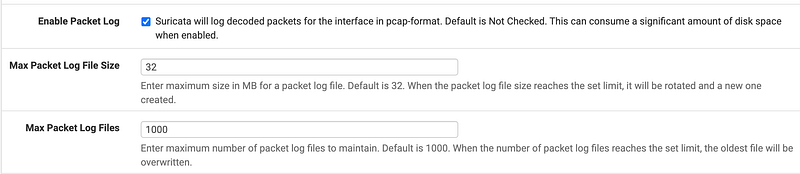
Enable packet capture
Before you can look at any packets triggering Suricata alerts, you have to enable packet capture.
Navigate to Suricata as I showed you in prior posts.
Services > Suricata
Click on the pencil icon next to an interface.

On the Settings tab …
Scroll down and check the box next to Enable Packet Log.

Click the Save button at the bottom.
Reboot the firewall:
Diagnostics > Reboot
Where are the logs?
Suricata logs are in the directory:
/var/log/suricataHere’s how you can access the logs.
Go to Diagnostics > Command prompt
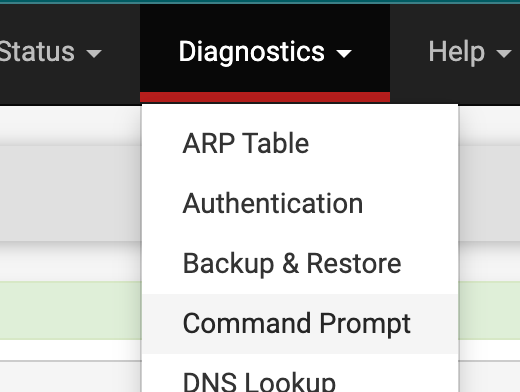
The top option allows you to run commands on the command line and view the results.
Type or copy and paste this command.
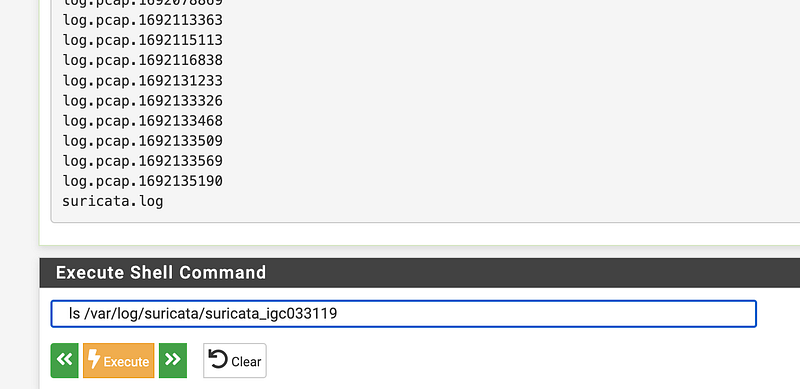
ls /var/log/suricataClick Execute.
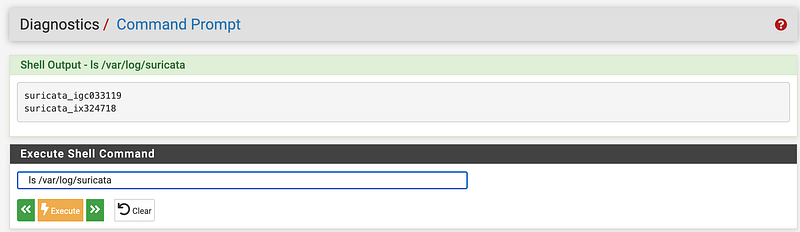
You’ll see the results at the top which is two directories. Next I can run the ls command on one of those directories:
ls /var/log/suricata/suricata_ix324718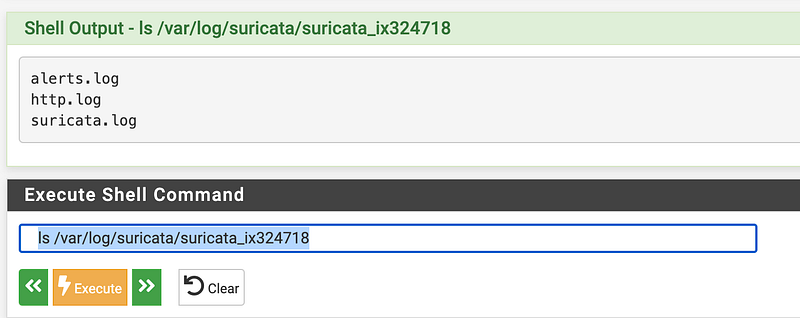
Now I can download those files using the next section on this same screen.
Here I’m downloading the alerts.log file.
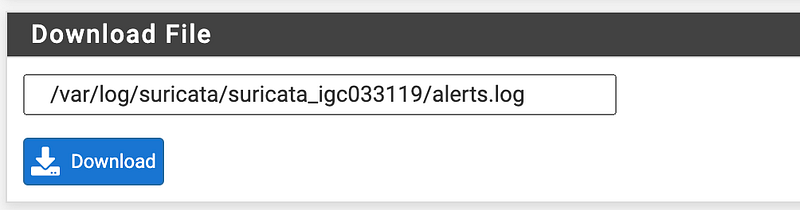
Save it somewhere on your machine you’ll be able to find it. :-)
Repeat for the other log files, including the log files in the other directory if you want.
Now if you navigate to the terminal where you saved the files on your local machine you can run this command to view the alerts.
cat alerts.logThis essentially gives you the same alerts you see in the console:

The http.log is empty in my case.
The suricata.log has some startup information.
Where are the packets?!
In the above example, as it turns out, I was looking at the directory for the wrong interface. I had only enabled packet capture on one interface and not the other. When I followed the same steps I got a list of files that included packet capture logs:
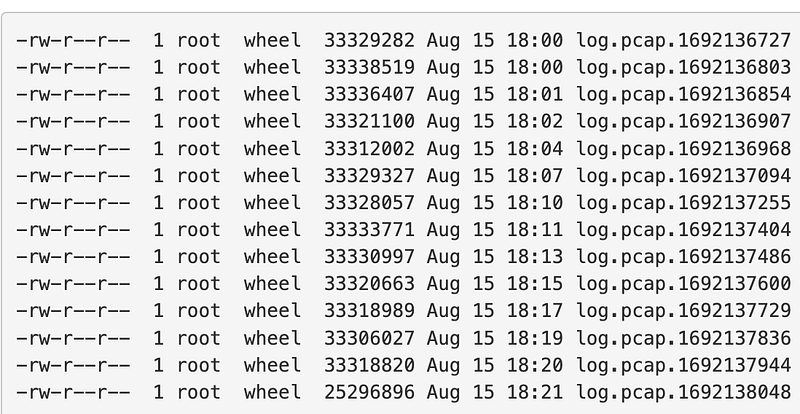
And…there were a bunch of them. As noted when you enable this feature, it can take a up a lot of space. You can change the settings related to how many log files this feature stores:
You can download the pcap file in that list the same way I did above and then open them in Wireshark to take a look at the packets.
Apparently pfSense literally chops off a packet in the middle, rather than gracefully determining the end of the last packet before the 32 MB cutoff.
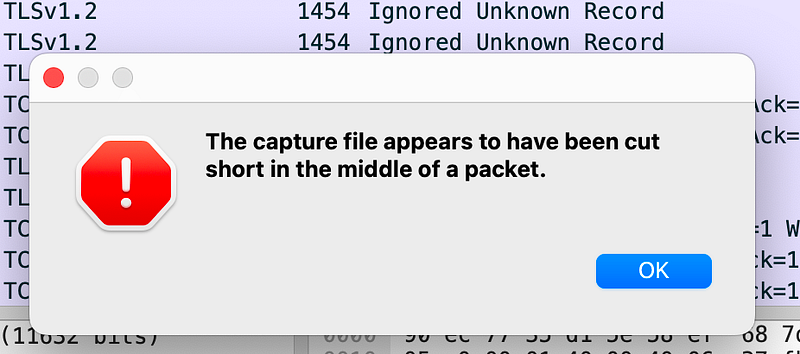
That could lead to some interesting analysis challenges.
Additionally you can see there are a number if Ignored Unknown Record entries in there. I’m not sure if that is related.
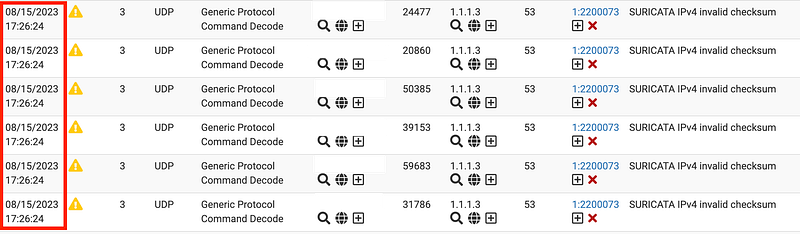
What I was interested in figuring out was what was causing all those invalid checksums in the WAN DNS traffic.
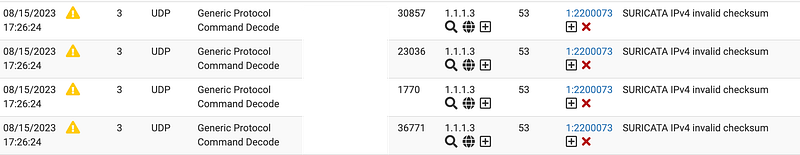
Over in Wireshark I can filter on DNS.
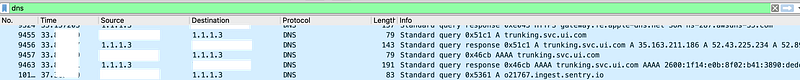
But there are a lot of DNS records…
To try to further narrow down my search, I can search on source port and the timestamp.
If I change my command to list the files to this:
ls -altr /var/log/suricata/suricata_ix324718/I can get a more human friendly date and time:
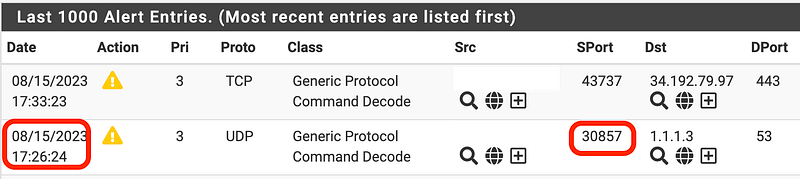
Unfortunately the lat of the records on port 53 that generated an alert is prior ot the time when I started capturing packets. So I’ll have to wait until that alert occurs again.
There were so many of these entries until I turned on packet capture — multiple per second. Hmm.
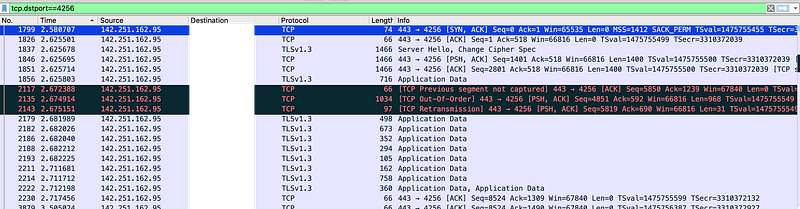
Well, this one is not a DNS record but let’s see if we can find it. In this case we’re looking for HTTPS traffic with a destination port of 4256. The timestamp is 8/15/23 18:17:18.
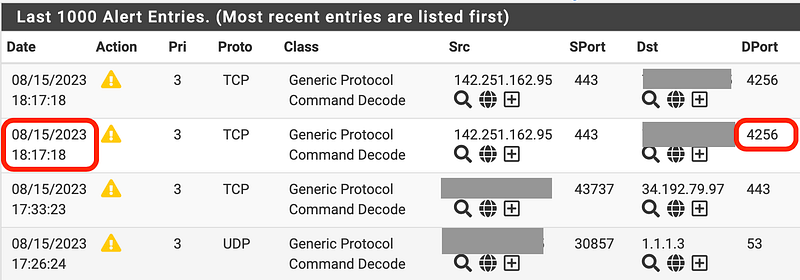
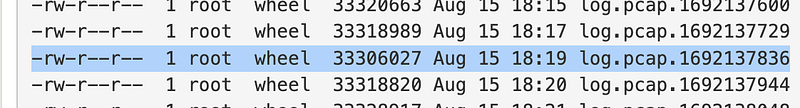
Based on the timestamp, looks like we need the next one after 18:17:18 which is:
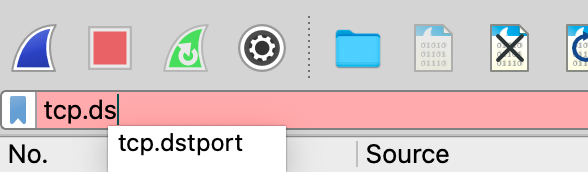
If I open that file and start typing tcp.d in the filter box, Wireshark recommends the field I want to query on (dstport which is short for destination port):
Well, looks like we have the right stream because the IP address matches our alert log entry:
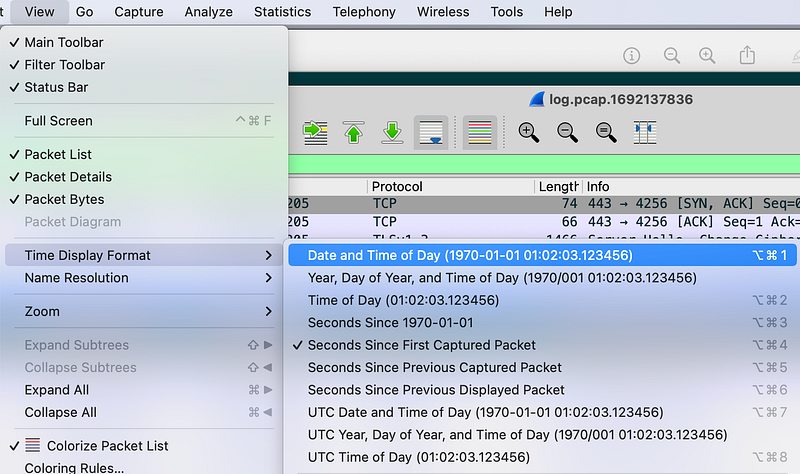
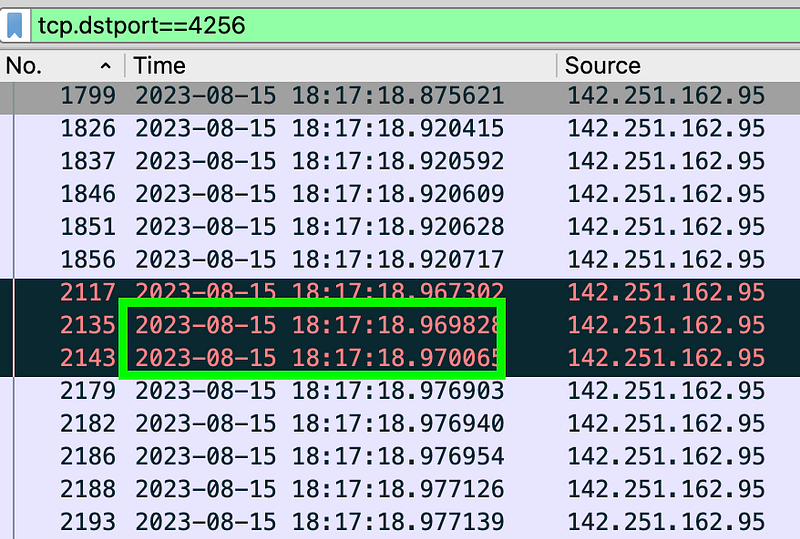
We can change the Wireshark timestamp display format to make things a bit easier to decipher.
Unfortunately there are a lot of packets occurring in the same minute so we’ll have to dive into a smaller time value to make the connection between the alert and a single packet.
If I head back over to the command line tool in the pfSense console I can run this command to find the alert in the alerts.log file.
cat /var/log/suricata/suricata_ix324718/alerts.log | grep :4256 | grep '142.251.162.95'That yields the two matching records with a bit more precise timestamps:

Cool. Now we can identify the specific packets that triggered the alert:
Looks like Wireshark flagged these records as well, and the one before it. Here are the Wireshark messages:

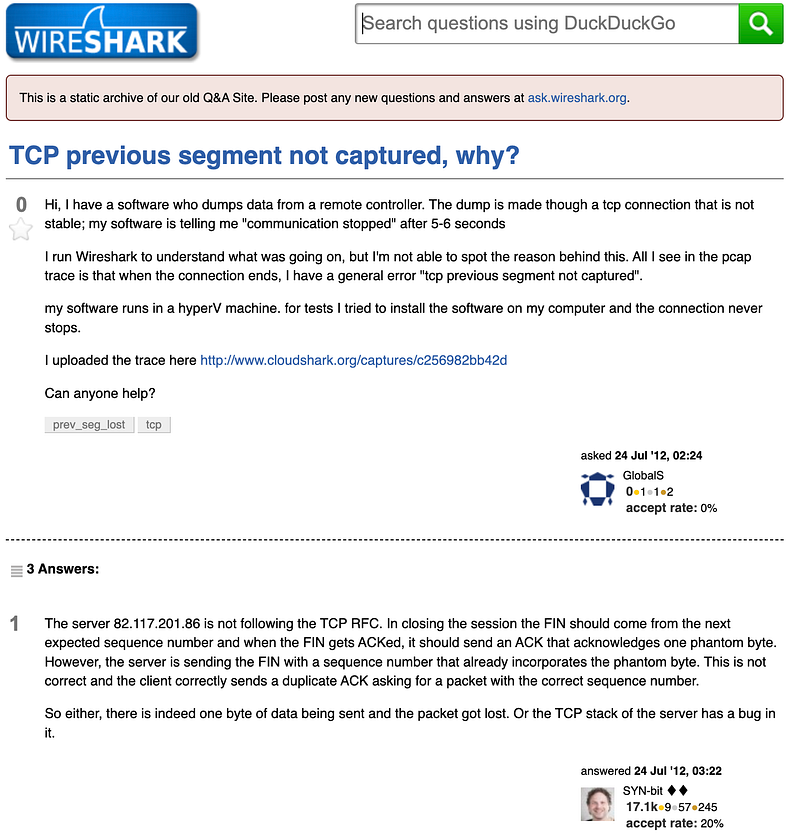
What causes the Previous segment not captured issue? The following post has some suspected causes. Once again we have a suggestion that this is a case of not following the specification as I wrote about in my last post. Some other suggested causes are in there as well — but it seems like packets are out of order or missing in any case.
After writing all that, I still haven’t seen any more of those strange DNS packets. Hmm. I did get another excessive transmission alert, which would have likely locked out the offending IP address if I had blocking turned on.
Although everyone says you should just turn these Suricata stream rules off, I wonder if there are actually some issues that could be resolved in the packets being sent. I seem to have the most problems with Google networking and Google products. That’s why I ditched Google WiFi to get more control over and visibility into my WiFi network. It was an experiment — one of many with WiFi networking products that didn’t really meet my networking hope and dreams (I would say requirements, but no WiFi product has ever yet actually met my requirements.)
That was fun but I actually have to get some work done now. I’m going to clear my alert logs since the alerts seemed to have slowed down and monitor and analyze new alerts from here on out using the pcaps.
And now you also can dig into what is really causing the Suricata stream alerts. You know how to enable packet capture, download the pcaps, and do some basic analysis to find the offending packets.
Follow for updates.
Teri Radichel | © 2nd Sight Lab 2023
About Teri Radichel:
~~~~~~~~~~~~~~~~~~~~
⭐️ Author: Cybersecurity Books
⭐️ Presentations: Presentations by Teri Radichel
⭐️ Recognition: SANS Award, AWS Security Hero, IANS Faculty
⭐️ Certifications: SANS ~ GSE 240
⭐️ Education: BA Business, Master of Software Engineering, Master of Infosec
⭐️ Company: Penetration Tests, Assessments, Phone Consulting ~ 2nd Sight Lab
Need Help With Cybersecurity, Cloud, or Application Security?
~~~~~~~~~~~~~~~~~~~~~~~~~~~~~~~~~~~~~~~~~~~~~~~~~~~~~~~~~~~~~
🔒 Request a penetration test or security assessment
🔒 Schedule a consulting call
🔒 Cybersecurity Speaker for PresentationFollow for more stories like this:
~~~~~~~~~~~~~~~~~~~~~~~~~~~~~~~~~~~~~~~~~~~~~~~~~~~~~~~~~~~~~
❤️ Sign Up my Medium Email List
❤️ Twitter: @teriradichel
❤️ LinkedIn: https://www.linkedin.com/in/teriradichel
❤️ Mastodon: @teriradichel@infosec.exchange
❤️ Facebook: 2nd Sight Lab
❤️ YouTube: @2ndsightlab