
Meta Medium
When’s The Best Day To Publish On Medium? (Final Results)
Are you ready for more math?

A month ago, I set out to answer one simple question.
To find my answer, I set up an experiment using my first account.
In my preliminary update, I told you I felt I wasn’t able to make any concrete conclusions because the data set felt too close together.
So, I waited. And I collected data. Then, in true Charlie J fashion, I revisited my original design and decided to go overboard.
Note: If you’re not interested in reading a bunch of math, the final findings are at the very end of the article. If you are a nerd (like me), prepare yourself for some riveting stats talk.
The Method (And The Madness)
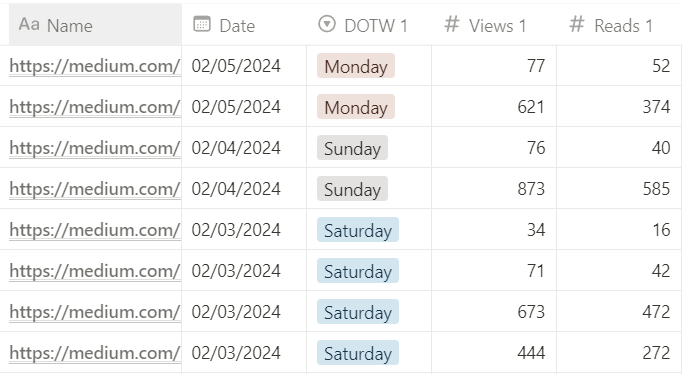
I put the stats of every single story I have published on both of my accounts into a Notion database.
I’m not kidding. A year of stories.
Disclaimers:
- I did not include any stories I posted and later unlisted.
- I also did not include any articles less than a week old.
- On my first account, I always published indiscriminately of date. On this account, I have been publishing every day. Meaning, my publishing dates have been either random or daily.
- These results are focused on the spirituality and meta-writing niches. As such, I can’t definitively say whether they’ll apply to other niches.
Average Reads and Views Per Day
This is probably the easiest way to get a glance at performance. I’ll just shoot some numbers at you real quick.
Sunday
Count*: 12 Average Views: 498 Average Reads: 370 Overall Read Ratio: 74%
*count is simply the number of data points, so in this case, there were 12 articles published on Sunday
Monday
Count: 15 Average Views: 382 Average Reads: 300 Overall Read Ratio: 78%
Tuesday
Count: 16 Average Views: 287 Average Reads: 217 Overall Read Ratio: 76%
Wednesday
Count: 12 Average Views: 376 Average Reads: 272 Overall Read Ratio: 72%
Thursday
Count: 21 Average Views: 836 Average Reads: 521 Overall Read Ratio: 62%
Friday
Count: 22 Average Views: 411 Average Reads: 301 Overall Read Ratio: 73%
Saturday
Count: 17 Average Views: 502 Average Reads: 384 Overall Read Ratio: 76%
Did You Also See Something Weird?
What is going on with Thursday?
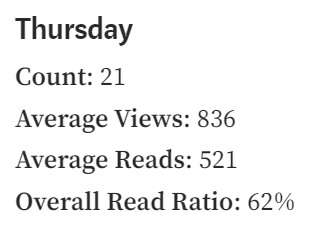
I took a deeper look and it turns out I have a crazy big outlier:

I removed this stat from the dataset for the rest of the calculations, and recalculated Thursday without the outlier considered:
Thursday
Count: 20 Average Views: 602 Average Reads: 477 Overall Read Ratio: 79%
Now That We’ve Got Thursday Sorted…
From the looks of the data set, it looks like Thursday is the best of the bunch.
Thursday has the highest average views, reads, and overall read ratio.
However, the story goes a bit deeper than that.
We need to talk about count.
If count is just a simple count of every article included in the calculations, can it really impact our results?
Well, I never intentionally tried to post on one specific day of the week. It just so happened that 22 of my articles posted on Fridays, while only 12 posted on Sundays.
Why did this happen? I don’t know. I genuinely couldn’t tell you.
But since there is almost double the number of data available for Fridays than Sundays, we need to level the field.
Introducing Range
Range is also a simple metric. It subtracts the lowest value from the highest value. This tells us how big of a spread our data has. Generally, the lower the spread, the more consistent the data.
For example, my lowest view value on Sunday is 44. My highest is 1000. 1000–44 = 956.
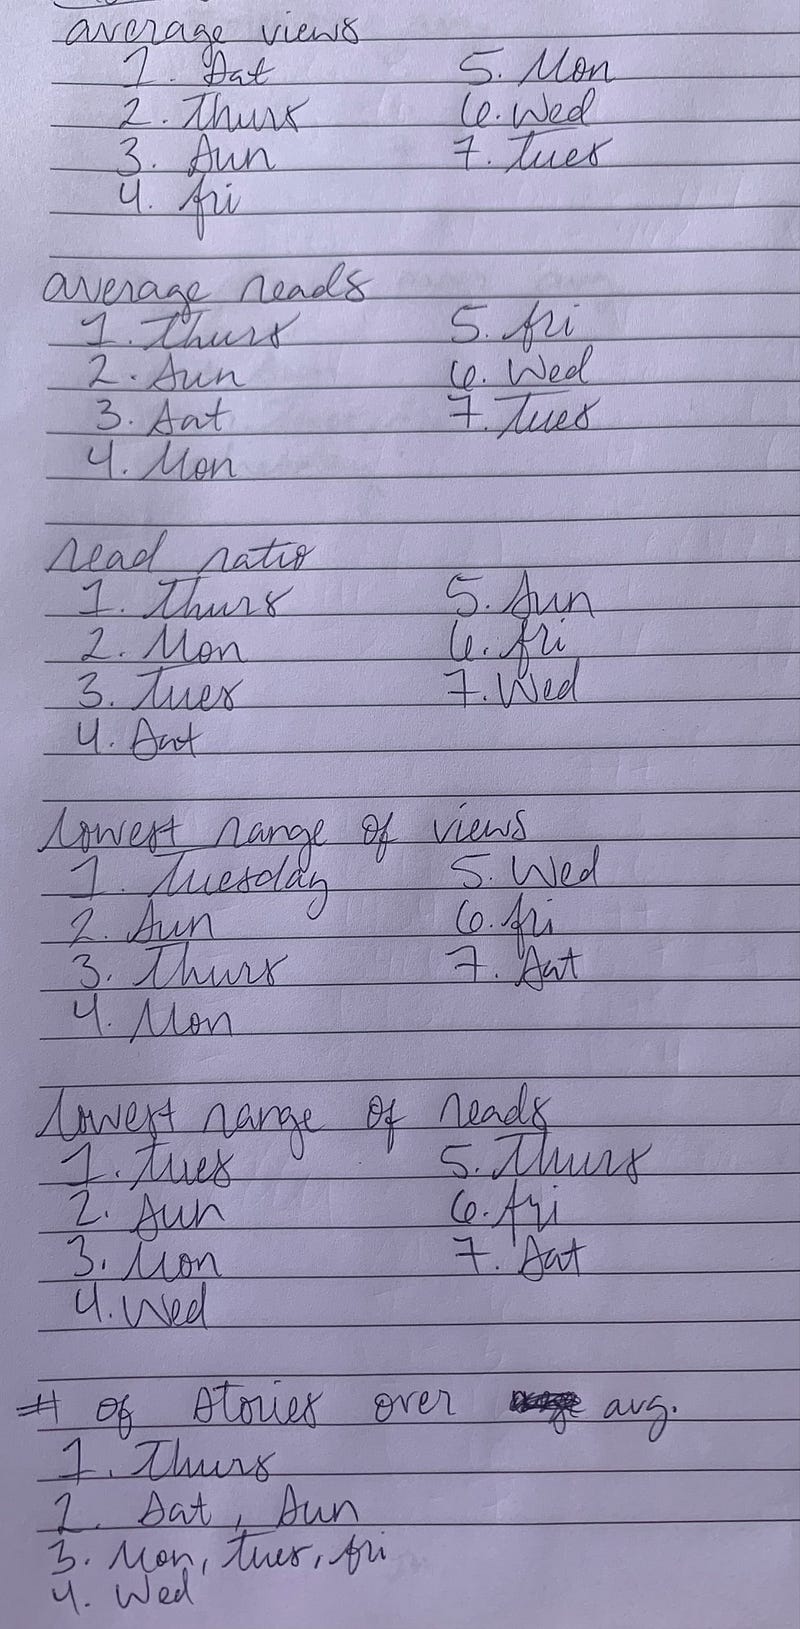
To get an idea of what a “low” range is, we need to know the range of each day of the week.
Sunday
Range of Views: 956 Range of Reads: 777
Monday
Range of Views: 1062 Range of Reads: 953
Tuesday
Range of Views: 649 Range of Reads: 576
Wednesday
Range of Views: 1434 Range of Reads: 1177
Thursday
Range of Views: 1266 Range of Reads: 960 Or, with the outlier: 5466 and 1387. Yikes!
Friday
Range of Views: 1663 Range of Reads: 1278
Saturday
Range of Views: 2066 Range of Reads: 1584
With these numbers, we can see that Sunday, Tuesday, Wednesday, and Thursday have data sets that are more reliable than Monday, Friday, and Saturday.
Just One More Piece of Math
I had one more metric I wanted to look at before I crowned a king here.
What was my average number of reads and views regardless of the day of the week?
Overall Stats
Count: 114 Average Views: 442 Average Reads: 336 Overall Read Ratio: 76%
Okay, great. So how many stories did each day have with stats better than my overall average?
Sunday — 7 stories Monday — 6 stories Tuesday — 6 stories Wednesday — 3 stories Thursday — 12 stories Friday — 6 stories Saturday — 7 stories
Interesting. Wednesday is really not pulling its weight, and it seems Thursday is picking up its slack.
Okay, So What’s the Best Day?
We’ve got a ton of data here.
How do we figure out which days are the best and which days suck?
Here’s the system I came up with:
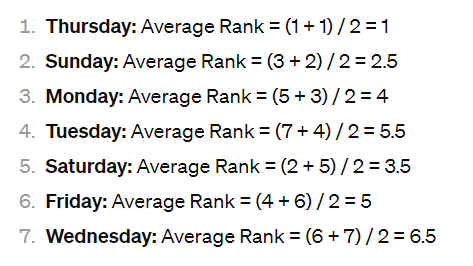
I ranked each day of the week per data set and used these rankings to get a numerical representation of each day’s value.
So, for example, if Sunday ranks #4 out of 7, I granted it a 4 for that category. With this method, the lower the number, the better the day is.
***Since there are ties in the final metric, I granted all tied values the same ranking.
Note: I ranked for all metrics mentioned except count.
With all this in mind, we come to our final rankings.
- Thursday — 13
- Sunday — 16
- Monday — 21
- Tuesday — 22
- Saturday — 24
- Friday — 30
- Wednesday — 35
This ranking treats every metric as equal, which is called a non-weighted measurement. Since views and reads are the most important metrics, I asked ChatGPT to give me a weighted measurement ranking.
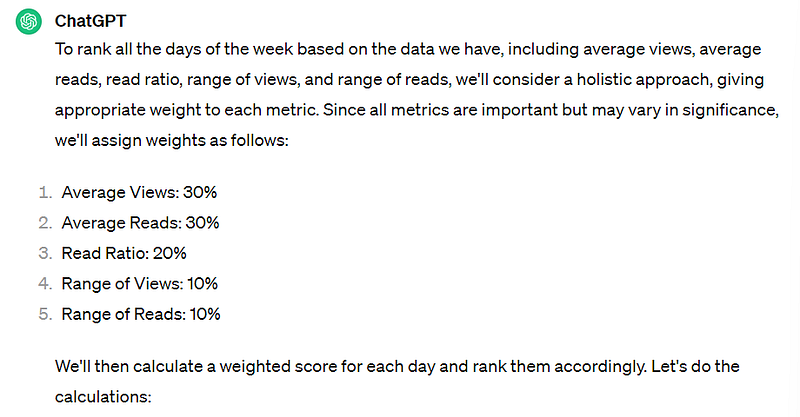
Here are the rankings ChatGPT came up with:
Honestly, it’s not that different from the non-weighted rankings. But hey, we didn’t come here to get two sets of answers, right? So I asked ChatGPT to give me a compromise ranking, creating a non-weighted third list from both of our findings.
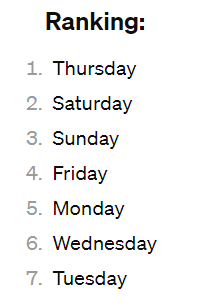
Final Results (Finally!)
Here are the final rankings based on six metrics and our compromise list:
- Thursday
- Sunday
- Saturday
- Monday
- Friday
- Tuesday
- Wednesday
Are You Shocked?
I’m shocked.
What do you mean Thursday is the best day? Followed by Sunday?
My job here isn’t to speculate — it’s to give my findings as neutrally as I can. I’d love to say I have a day-of-the-week bias (the drama!!), but I have nothing invested in Thursday winning or Wednesday losing.
I’ll turn it over to you.
What are your theories on why Thursday is the best day and Wednesday is the worst?
If you can’t think of any logical explanation, I’m also down to read your craziest conspiracy theories too.
I hope this article was helpful to you! This was a fun experiment to hold, even if it did take over a month to get the final results. Now, if you’ll excuse me, I have to go do literally anything other than more math.
Tchau! :)
Thanks for reading!
If you’d like to maximize your growth as efficiently as possible, sign up for my free 5-day email course here. I’d love to help you become the best writer you can be.