
What’s Going On With Inflation?
Is this Weimar Germany, 1970’s America, or something else?
Traditional economics claims that a government can’t add more than $5,000,000,000 into an economy without inflation showing up somewhere, somehow.
Modern Monetary Theory says that a government can push however much money they want into an economy without showing any inflation at all, so long as there is economic productivity is not at a maximum.
So which is right?
Like any economics question, it depends on what is being measured.
Traditional Inflation Metrics
The Bureau of Labor Statistics tracks inflation using two major indices:
- Consumer Price Index
- Producer Price Index
Consumer Price Index
One of the best known inflation metrics is CPI, or Consumer Price Index. In short, CPI measures the cost increase or decrease of purchase prices (i.e. the final cost that the consumer pays).
From the Bureau of Labor Statistics (emphasis added),
The Consumer Price Index (CPI) is a measure of the average change over time in the prices paid by consumers for a representative basket of consumer goods and services.
The CPI measures inflation as experienced by consumers in their day-to-day living expenses.
The CPI is used to adjust income eligibility levels for government assistance, federal tax brackets, federally mandated cost of living increases, private sector wage and salary increases, and consumer and commercial rent escalations.
Like any good economic indicator, CPI has many flavors. Here are some examples, with very basic explanations.
- Standard CPI: contains the entire basket of goods for all consumers
- Core CPI: excludes food and energy (which have highly volatile prices)
- CPI-U: CPI for all urban consumers, regardless of job status
- CPI-W: CPI for all urban wage earners who receive a steady paycheck
Standard CPI is the metric most widely covered, with the April 2021 measurement at 2.6%
CPI does have some issues, but overall its not a bad metric.
Producer Price Index
PPI measures inflation from a manufacturer’s perspective.
Instead of measuring the final cost of products or services paid by the consumer, PPI measures the price of goods sold by the manufacturer to a wholesaler, distributor, or other reseller.
Like the CPI, PPI consists of several parts.
- Industry Classification: price changes for goods within a certain industry
- Commodity Classification: price changes for goods, regardless of industry
- Commodity-based Final Demand-Intermediate Demand (FD-ID) System: granular data by sub-product, type of buyer, and processing/assembling effort
“Final Demand”, found within the FD-ID, is the main number found in news headlines. As of this writing, it had an annual increase of 4.2%.
Alternate Inflation Metrics
As with any government data, there are those who question the “official” numbers (and probably with good reason).
Here are two of the most popular sources of alternate data.
Shadowstats
This website was started way back in 2004, when a consulting economist, Walter J. Williams, did deep dive into governmental statistics and economic reporting for a client.
During his research, he found a few calculations that did not compute, then a few more, then a few more. ShadowStats was born out of his desire to publicly share his concerns.
For inflation, his main criticism is that the calculation of CPI used today does not accurately reflect the one from 1980. Below is his chart comparing the official CPI and the ShadowStats CPI.
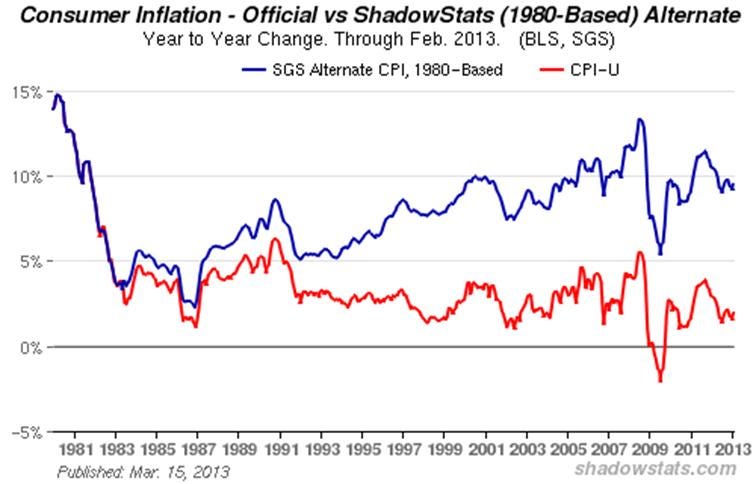
Chiefly, Williams claims that the use of substitutions (e.g. buying ground beef when steak is priced too high) is over weighted.
The overuse of substitutions results in two linked, but distinct, effects:
- The impact of price increases is muted, as we can buy cheaper stuff while spending the same amount, meaning no “official” inflation.
- The “standard quality of life” is reduced, since those cheaper items are of lower quality, hence their lower price.
In short, our quality of life is deflated when we can’t afford financial inflation.
Chapwood Index
In addition to taking umbrage with the adjustments to CPI in the 1980’s and 1990’s, the Chapwood Index also claims that the current calculation of CPI was too unwieldy, exploding to 80,000 or so items, with complex algorithms representing substitution, income discrepancies, and other nuances that are extremely difficult to model.
To combat this complexity, Ed Butowski, a financial advisor, created the Chapwood Index.
The Index was created by asking Butowski’s social media contacts what they bought with after-tax income, then narrowing down the responses to the top 500 items.
The prices of those items were then tracked year over year, and the Chapwood Index was now populated.
This sounds all well and good, but this Index has its own problems, such as its out-of-date list of items, including
- PlayStation (not the PS4)
- Netflix rental (not Netflix streaming, or any other streaming service)
- Digital cameras (most of which have been replaced with smartphones)
Overall, the idea has merit, but the execution is flawed.
Inflation in Unique Services and Goods
Lastly, we can look at individual items or categories. Most CPI measurements contain a lot of things, but a price increase of just one thing can wreak havoc.
Lumber
Let’s take a look at lumber.
Normally, the price of wood is not on anyone’s radar. It is assumed to always be around in abundant supply and low cost, never failing to meet demand.
Now, raw wood is becoming more scarce, saw mills can’t begin to keep up with demand, and the price of finished lumber is skyrocketing.
Fortune sums it up nicely.
From the onset, the pandemic was a perfect storm for surging lumber prices.
At the same time that sawmills were limiting production during the early months of the crisis, the pandemic was spurring a do-it-yourself (DIY) boom among Americans stuck at home.
That supply and demand mismatch was made worse by record low interest rates and a historically tight existing housing inventory which caused buyers to rush to new construction.
The backlog is so big that prices aren’t falling despite wood production hitting a 13-year high in February.
Lumber prices may just be an inconvenience to the homeowner who is staying put, as that backyard shed project will just get delayed a year or two.
However, this price inflation is squeezing home builders and buyers of new construction homes, as the price increase has added an average of $24,000 to the cost of a new home.
Gasoline
Gas is always on a roller coaster, pretty much mimicking the cost of crude oil. Just during the pandemic, prices have gone from flirting with $1.00/gallon to approaching $3.00/gallon.
That’s a 200% price increase in a single year.
The volatility is why the government likes to remove gasoline from the Core CPI calculation. The problem is that gas is used by so many people, either directly in their cars or indirectly in public transportation.
The Bottom Line on Inflation (For Now)
We’re going to see some inflation, especially with a) the injection of trillions of dollars into the economy and b) the Fed wanting to be greater than 2% inflation before acting to tamp it down again.
However, it the consensus seems to be that it will be temporary, meaning less than two years, and sporadic, hitting individual sectors rather than the wholesale inflation we saw in the 1970’s.
The Conference Board summed it up nicely.
Expectations of a sudden surge in consumer and producer price inflation associated with easy monetary and fiscal policy likely are overdone.
Price increases anticipated with the rotation of household purchases from goods to services probably will be transitory, especially as prepandemic disinflationary pressures reassert themselves.
And here is the official stance on inflation from the White House.
We think the likeliest outlook over the next several months is for inflation to rise modestly…, and to fade back to a lower pace thereafter as actual inflation begins to run more in line with longer-run expectations.
Such a transitory rise in inflation would be consistent with some prior episodes in American history coming out of a pandemic or when the labor market has quickly shifted, such as demobilization from wars.
The heavyweights are saying that inflation will be turbulent in the short term, but stabilize in the long term.
It will be interesting to see if that actually happens.
Most Recent Stories
- Are We In Housing Bubble 2.0?
- Biden’s Infrastructure Plan Is Good, But Not Great
- Jobs, Jobs Everywhere, and Not a Soul to Work
- COVID Destroyed Women’s Finances
Don’t miss my next article! Click here to get notified when I publish new material.
If you love the articles published in Money. Daily., then become a member of the Medium community and get full access to our full archives.
This article is for informational purposes only, it should not be considered Financial or Legal Advice. Not all information will be accurate. Consult a financial professional before making any major financial decisions.