
Freewriting // Day 7
What Topics Do Your Readers Like?
And one confound to consider

A common tactic that’s recommended by successful writers has been to track which topics resonate with your readers and spend more time contributing to those themes.
Various forms of this tactic have been presented, including trying up to five different themes per week (i.e., one general theme per workday) and seeing if there are particular themes that people like more from the week.
This is such a great idea to experiment with different topics and not have to niche down into one topic, and really aligns with the idea of revolving themes that develop multiple intersecting niches.
But when I read this with my researcher lens, the word CONFOUND screams out to me, loud and clear.
What is a confound?
We like to think about the world in concrete terms because it saves our brains times, and one shortcut we like to take is just to assume that one thing directly influences another.
In this case, the simplified understanding is that the topic accounts for enough of an influence on readership that we’re ignoring other variables. The real world is messier than that.
While to some degree, topics of interest do influence whether people read what you write, other factors can impact how much the topics you choose to write about are really affecting your reading metrics.
Did all the bars and restaurants just open in your area, post-pandemic? That’s going to have an impact on your readership — because can you blame people wanting to go out after 12+ months stuck inside?
This alternate explanation (rather than just your main variable of interest) is considered a confound to your endeavour to figure out whether topics actually influence readership.
A neater example
On my art twitter, I try to support artists using a revolving theme of different art shares each week. Each day is associated with a different colour theme, and artists are invited to share art they have that are majority related to that colour theme.
Here is the schedule:
Monday: Red Tuesday: Orange Wednesday: Yellow Thursday: Green Friday: Blue Saturday: Purple Sunday: Pink
A pattern I’d noticed over time is that Blue, Purple and Pink are the colours that are most popular.
At first, I thought it was a colour-related reason — blue, purple and pink are relatively easier to work with as cool colours, whereas brighter, warmer colours are sometimes less commonly seen depending on artists’ style. I thought colour was the main contributing factor to these art shares being more popular.
But, is that true? Blue, purple and pink are also my weekend art share days. An alternate explanation is that artists, particularly hobby artists who have other day-jobs and school, are occupied most weekdays but have more time to hop in and share their artwork on the weekend. A different factor that might explain the popularity of these art shares is the weekend.
Realistically, both colour and day of week probably contribute to it. A lot more artists hold their own art shares on the weekend for the reason that weekends are more popular (supporting the weekend hypothesis). At the same time, a lot of artists enthusiastically jump on to blue, purple and pink art shares proclaiming their love for these colours, with more artists reflecting on Wednesday that they don’t nearly use yellow enough in their art.
Latin Squares and how they solve this issue
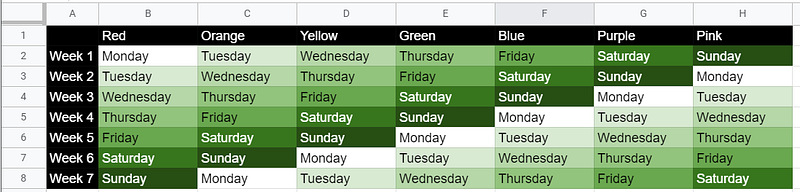
So, if I really wanted to know whether it was colour or day of the week contributing to the popularity of my art shares, I’d want to make sure that a certain colour didn’t fall on a certain day of the week.
To ensure that a colour like red falls on every day of the week, popular (weekends) or unpopular (Wednesday), I’d want to make sure that over the course of 7 weeks, it shows up as an art share colour for each of the seven days of the week, like in the “red column”.
The rest of the colours would rotate in the same way, forming a beautifully conditionally formatted Latin Square that rotates through each of the seven colours so that they each fall on each day of the week at least once.
That way, if you look at the popularity over the seven weeks for each colour, the resulting popularity would have accounted for the colour showing up in both popular and unpopular parts of the week.
Back to the topic of Topics
So if you wanted to explore whether certain topics actually contributed to better readership regardless of which day of the week it is, you might want to use a latin square like this:
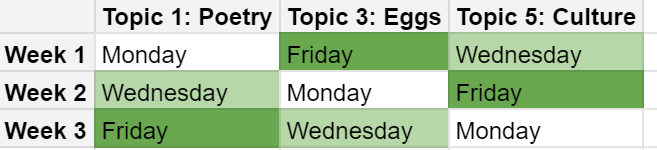
If you wrote three times a week on topics like poetry, eggs and culture, you might want to mix it up so that “Eggs” doesn’t always fall on Friday. Maybe this niche topic isn’t actually that popular but more people are reading about it simply because it’s Friday and they have nothing better to do.
Maybe, in fact, people most want to read poetry on Friday to wind down as part of the weekend self-care, but because you place poetry pieces on Monday, a day when fewer people check for reading because they’re tired from work, you never find that out.
Take-home points
(I really like conditionally formatting in Excel / Google Sheets to create conditional formatting, and will willingly do so for an article on a Sunday.)
Be sure to decouple popularity associated with different days of the week from the topics themselves if you’re trying the “one topic per day” tactic. I find that day of the week really does impact how much people read, and this makes sense — a lot of us have more pressing responsibilities than leisurely reading during the week than during the weekend.
Hi I’m Lucy Dan 蛋小姐 (she/her/她) and honestly, maybe I don’t write about eggs as often as I should. Perhaps, an egg-themed series? Would you read that, regardless of whether it’s hump day Wednesday or precious relax time Saturday? Ps, you can listen to this and other poems re-imagined in podcast form!
^ by Connie Song


