
Understanding Multiple Linear Regression
With video explanation | Data Series | Episode 4.4

We have taken a look at Simple Linear Regression in Episode 4.1 where we had one variable x to predict y, but what if now we have multiple variables, not just x, but 𝑥₁,𝑥₂ and 𝑥₃ … to predict y — how would we approach this problem? I hope to explain in this article.
Simple Linear Regression Recap
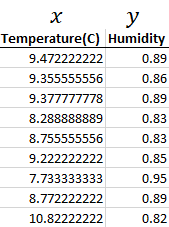
From Episode 4.1 we had our data of temperature and humidity:
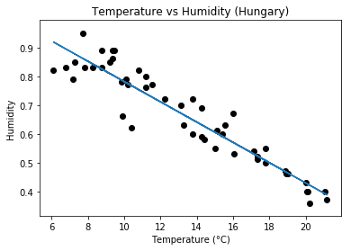
We plotted our Data, found and found a linear relationship — making linear regression suitable:

We then calculated our regression line:
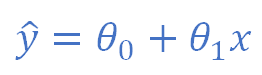
using gradient descent to find our parameters θ₀ and θ₁.
We then used the regression line calculated to make predictions for Humidity given any Temperature value.
What is Multiple Linear Regression?
Multiple linear regression takes the exact same concept as simple linear regression but applies it to multiple variables. So instead of just looking at temperature to predict humidity, we can look at other factors such as wind speed or pressure.
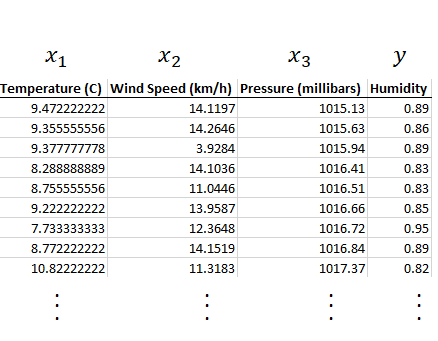
We are still trying to predict Humidity so this remains as y.
We rename Temperature, Wind Speed and Pressure to 𝑥₁,𝑥₂ and 𝑥₃.
Just as with Simple Linear Regression we must ensure that our variables 𝑥₁,𝑥₂ and 𝑥₃ form a linear relationship with y, if not we will be producing a very inaccurate model.
Lets plot each of our variables against Humidity:
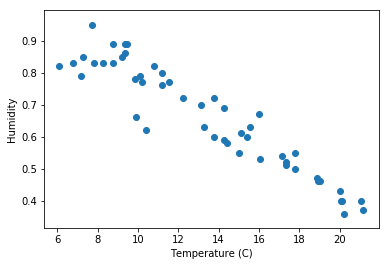
- Temperature and Humidity form a strong linear relationship
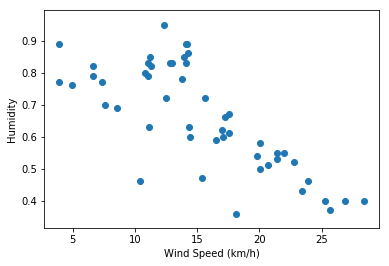
- Wind Speed and Humidity form a linear relationship
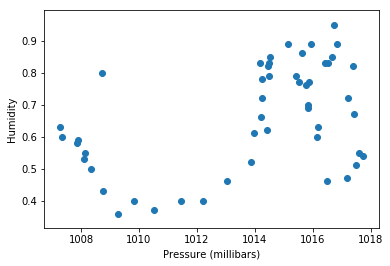
- Pressure and Humidity do not form a linear relationship
We therefore can not use Pressure (𝑥₃) in our multiple linear regression model.
Plotting our Data
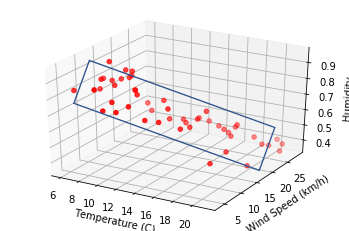
Let’s now plot both Temperature (𝑥₁) and Wind Speed (𝑥₂) against Humidity.
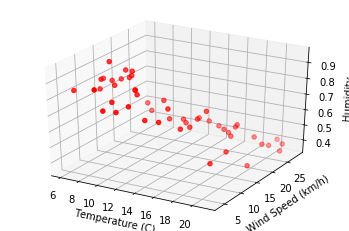
We can see that our data follows a roughly linear relationship, that is we can fit a plane on our data that captures the relationship between Temperature, Wind-speed(𝑥₁, 𝑥₂) and Humidity (y).
Calculating the Regression Model
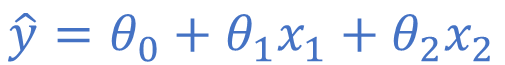
Because we are dealing with more than one 𝑥 variable our linear regression model takes the form:
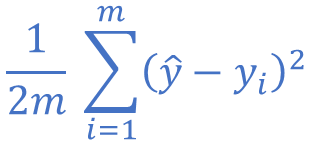
Just as with simple linear regression in order to find our parameters θ₀, θ₁ and θ₂ we need to minimise our cost function:
We do this using the gradient descent algorithm:
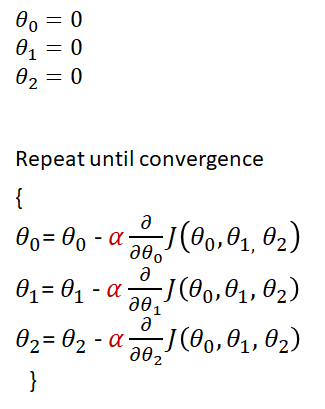
This algorithm is explained in more detail here
After running our gradient descent algorithm we find our optimal parameters to be θ₀ = 1.14 , θ₁ = -0.031 and θ₂ =-0.004
Giving our final regression model:
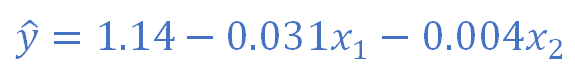
We can then use this regression model to make predictions for Humidity (ŷ) given any Temperature (𝑥₁) or Wind speed value(𝑥₂).
In general models that contain more variables tend to be more accurate since we are incorporating more factors that have an effect on Humidity.
_________________________________________
Potential Problems
When including more and more variables in our model we run into a few problems:
- For example certain variables may become redundant. E.g look at our regression line above, θ₂ =0.004, multiplying our wind speed (𝑥₂) by 0.004 barely changes our predicted value for humidity ŷ, which makes wind speed less useful to use in our model.
- Another example is the scale of our data, i.e we can expect temperature to have a range of say -10 to 100, but pressure may have a range of 1000 to 1100. Using different scales of data can heavily affect the accuracy of our model.
How we solve these issues will be covered in future episodes.


