
Understanding Financial Risk Models: A Guide to Credit Risk, Stress Testing, and More
Financial institutions use a variety of models to manage risk.
These models help them control NPAs (non performing assets) by predicting credit risk, calculate the required capital to cover the losses, and ensure they’re prepared for all sorts of financial surprises — the bad ones!.
Let’s break down some of the key models and the math behind them.

1. Credit Risk Models: Will You Pay Back Your Loan?
Let’s start with credit risk models. These are used to evaluate the probability that the borrower will default on a loan.
It’s like a magic crystal ball for bankers: “Will this person pay back their loan or not?”
For individuals, we have retail models (think personal loans, credit cards), and for companies, there are wholesale models (big corporate loans).
One of the most popular model here is logistic regression.
The formula to predict the probability of default (PD) looks like this:
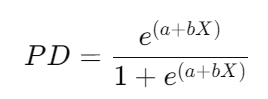
Here, `X` represents borrower characteristics (like income, debt, credit history), and a, b are coefficients that the model learns from the data.
Example Calculation:
Imagine you’re a lender. You have a potential borrower with the following characteristics:
- Credit score (X) = 700
- Coefficients a=−1.2, and b=0.003
The probability of default (PD) would be:
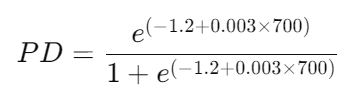
This comes out to be 0.71. In simple terms, there’s a 71% chance this person might default on their loan. Yikes! Maybe think twice before approving that loan!
2. IFRS9 Models: Predicting Expected Credit Losses (ECL)
Next up, we’ve got IFRS9 models, which is about predicting Expected Credit Losses (ECL). This is crucial for banks because they need to set aside money to cover potential losses upfront.
The formula for ECL is:
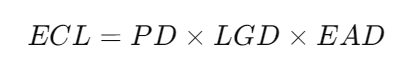
- PD: Probability of Default (from our logistic regression model)
- LGD: Loss Given Default (what percentage of the loan might not be recovered if the borrower defaults)
- EAD: Exposure at Default (how much money is at risk if the borrower defaults)
Example Calculation:
Let’s say:
- PD=0.71
- LGD=0.4 (meaning the bank expects to lose 40% of the loan amount if there’s a default)
- EAD=100,000 (the total loan amount)
Then,
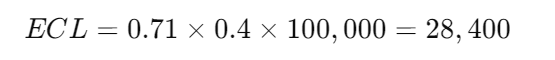
So, the bank should expect to lose $28,400 if this loan is defaulted. Better be prepared!
3. Stress Testing and Scenario Analysis Models: Are We Ready for the Worst?
Now, let’s talk about Stress Testing and Scenario Analysis Models.
These are like financial disaster drills for banks.
They want to know, “Can we survive a financial apocalypse?”
We often use Monte Carlo simulations here. Imagine running thousands of different scenarios to see how much you might lose in each case.
The formula for the Monte Carlo estimate is:
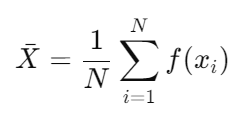
Where:
- N = number of scenarios
- f(xi) = the loss in each scenario
Example Calculation:
Let’s say we run 5,000 simulations, and our average loss is $2 million. That’s our expected loss in a worst-case scenario.
4. Economic Capital Models: Keeping Enough in Reserve
Economic Capital Models estimate how much capital a bank needs to keep in reserve to stay afloat.
These models often use Value-at-Risk (VaR), which estimates the maximum loss over a period for a given confidence interval.
The formula for VaR is:
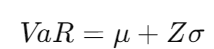
Where:
- μ = mean loss
- Z = Z-score from the normal distribution
- σ = standard deviation of losses
Example Calculation:
Say:
- μ=1,000,000 (average loss)
- σ=200,000
- Z=1.645Z (for a 95% confidence level)

What it means is that the bank needs $1,329,000 in reserve to cover potential losses with 95% confidence.
5. Financial Vulnerability Models: Spotting the Weak Links
These models are like the bank’s health check-up. They help identify weak spots that might lead to a crisis.
Think of it like trying to predict when your car might break down based on how it’s been behaving lately.
They often use statistical techniques like logistic regression (yep, our old friend again!) to analyze various indicators that might predict a crisis.
6. Pricing Models: What’s the Right Price?
Now, let’s talk about Pricing Models. If you’ve ever wondered how the price of an option is determined, you’re in for a treat. One popular method is the Black-Scholes model. It’s like magic for finance nerds!
The formula is:
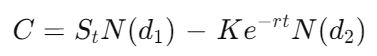
Where:
- C= Call option price
- St = Current stock price
- K = Strike price
- r = Risk-free interest rate
- t = Time to expiration
- N(d1) and N(d2) = Cumulative distribution function values of the standard normal distribution
7. Traded Risk Models: Managing Market Volatility
Traded Risk Models help banks and investors evaluate the risks associated with trading activities. Think of it as checking the weather before setting sail.
Value-at-Risk (VaR) is also used here to estimate the potential loss in trading portfolios over a defined period.
8. Insurance Risk Models: Estimating the Impact of Claims
Last but not least, we have Insurance Risk Models. These help insurance companies estimate the likelihood and impact of claims.
The formula for calculating the expected loss is:
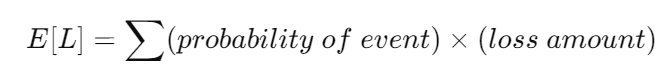
Example Calculation:
If there’s a 1% chance of a $500,000 claim and a 0.5% chance of a $1,000,000 claim:

The expected loss would be $10,000.
Wrapping Up: Why Do These Models Matter?
And there you have it, my friend!
A whirlwind tour through the fascinating world of financial risk models.
Whether it’s predicting if someone can pay back a loan, figuring out how much money to keep on hand, or making sure the bank is ready for a financial storm, these models are essential for managing risk.
So next time you hear about financial risk, you’ll know there’s a whole lot of math — and a bit of magic — behind it!
If you’re also interested in statistics, data science and machine learning, you’ll like these blogs:
- Analyzing Loan Data with Binomial and Poisson Distributions in Python
- Exploring Credit Risk and IRFS9 Models
- Mastering Credit Risk Analysis: A Step-by-Step Guide to Descriptive Statistics in Python
- The What, Why, and How of Generative AI
- Credit Risk Modeling in Python
- Top 20 FAQs on Descriptive Statistics for Data Science Aspirants
- Top 15 Probability Distribution Questions for Data Science Interviews
- 10 Movies to Binge-Watch for Data Science and AI Nerds!
You can also connect with me on LinkedIn.
Until next time, keep crunching those numbers and may your calculations always be accurate!