
The Value of Positioning: An Innovative Approach to Measuring Player Impact in Football
A new way to measure the quality of players’ positioning and scoring opportunities that takes into account the continuous nature of the game
The paper “A new look into Off-ball Scoring Opportunity: taking into account the continuous nature of the game” by Hugo M. R. Rios-Neto, Wagner Meira Jr., Pedro O. S. Vaz-de-Melo, presented at the Barcelona Analytics in Sports Tomorrow conference in 2020, proposes a novel approach to measuring the quality of football players’ positioning to receive a pass and score. By calculating the Off-Ball Scoring Opportunity model for every timestep that an attacking player has the ball at their feet, the authors demonstrate how time-series analysis can provide a more in-depth view of attacking creation at both an individual and team level.
Introduction
The introduction of the research paper discusses the challenges of creating ways to analyze football games quantitatively that align with the decision-making process intrinsic to the game. To address this challenge, the Off-Ball Scoring Opportunity (OBSO) model was developed by Spearman in 2018 to evaluate players’ off-ball positioning that could lead to goals.
The OBSO model rewards players for good positioning in areas where they can receive a pass, control the ball, and score, making it a better predictor of future goals than past goals or shots. However, the OBSO model only uses tracking data from the timestamps of the game that match event data, which means that it can only analyze the off-ball positioning of attackers when the action was executed. To address this limitation, the authors propose a new way of using the OBSO model where a player can transition the ball to himself, and all on-ball touches are relevant instead of only on-ball events.
The authors apply this methodology to a small public dataset containing some goals Liverpool scored during 2019 and present three primary forms of evaluating attacking plays using their methods. Finally, the authors discuss some practical applications of their work and how this different approach may fit football better due to its continuous nature.
Data
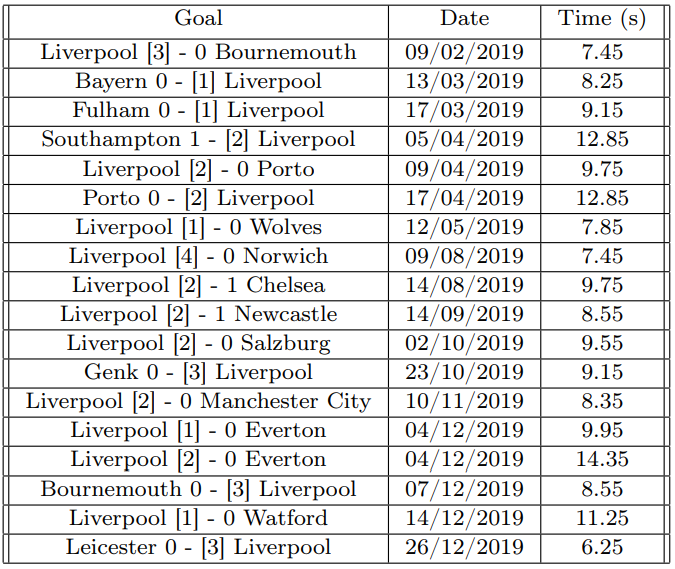
In this section, the paper describes the data used for analysis in this work. The data includes tracking data from 18 out of 19 open-play goals scored by Liverpool during 2019, which was obtained from a public dataset made available through the Friends of Tracking initiative. The data was collected using homography on video frames, which extracted the coordinates on the field for every player on the screen and the ball. The data was recorded at a frequency of 1–2Hz and was interpolated to 20Hz. Although the data lacks accuracy, it can still be beneficial for application purposes, as spatiotemporal tracking data availability is limited.
In addition to players’ positions, their velocities at every point in time are also crucial for applying the Off-ball Scoring Opportunity model. The paper describes the process of calculating player velocities by dividing their displacement by the timestep between frames and applying a moving average filter to smooth the velocities. The authors also set a maximum speed that a player can realistically reach to ensure that potential errors in the players’ positions do not yield unrealistic velocities.
Methods
In this section, the authors first go through the Off-ball Scoring Opportunity (OBSO) model, pointing implementation differences from the original work, which were mostly due to lack of data, data inaccuracies and for simplification purposes. Later, they propose a different way of choosing the sequence of moments in which to calculate the OBSO, instead of only at the timestamp an event happens.
Off-ball Scoring Opportunity
In this section of the research paper, the Off-ball Scoring Opportunity (OBSO) model is introduced. The model is used to calculate the probability of the attacking team scoring after the next event, at a specific instant.
The model requires three probabilities to be calculated: transition, control, and score. 1. The transition probability (T_r) is the probability of the ball being transitioned from its original location to an arbitrary point, r on the pitch. 2. The control probability (C_r) is the probability that the ball, at this arbitrary point r, will be controlled by the attacking team. 3. The score probability (S_r) is the probability of scoring from this arbitrary point r.
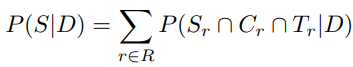
By multiplying these three probabilities, the likelihood of all three events occurring is obtained. The total probability of scoring after one transition of the ball, at a specific moment, is then defined as a function of the game state and the set of all points on the field. The research paper proposes a different way of choosing the sequence of moments in which to calculate the OBSO, instead of only at the timestamp an event happens. The next sections will explain the transition, control, and score models in detail.
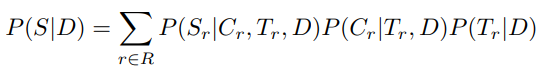
The probability in Equation 1 can be decomposed into a series of conditional probabilities, forming the following equation
Control Model
In this section, the authors explain the Control Model, which is used to determine the probability of a player controlling the ball at a specific location on the field. The model, known as the Potential Pitch Control Field (PPCF), takes into account the player’s proximity to the ball and the time it takes for the ball to reach its destination. The authors used an average ball speed of 15m/s to calculate the ball’s travel time to a target position, instead of considering aerodynamic drag, as done in the original work.
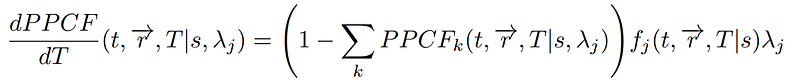
The probability of a player controlling the ball in a particular location at time t is calculated using a differential equation.
The probability of a player reaching a location r in less than time T is denoted by:
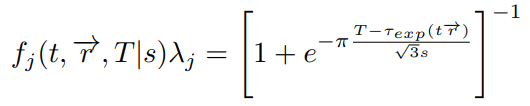
The expected intercept time is the time it takes for the player to reach location r from their current position with a starting speed of v_j(t), constant acceleration a, and maximum velocity v. The control rate represents the inverse of the mean time it takes a player to make a controlled touch on the ball. The higher the control rate, the less time it takes for a player to control the ball. The authors set the control rate to 3.99, and when a player is offside, their control rate is zero.
A per-player probability for control is built by integrating the first equation over T from 0 to ∞. Overall, the Control Model determines the probability of a player controlling the ball at a given location on the field, given that the ball has moved to that location.
Transition Model
In this section, the paper discusses the Transition Model which measures the probability of the next touch on the ball occurring at a specific location on the field. The authors note that players tend to attempt short passes with higher frequency due to the normally distributed distribution of displacements between subsequent ball events. Additionally, the variance in target location increases with long passes due to angular variance.
To incorporate decision-making into the transition model, the authors superimpose the PPCF model, which gives the probability of the ball being controlled by the attacking team if it goes to a specific location on the field, with the normal distribution to construct a decision probability density field.
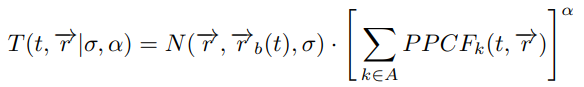
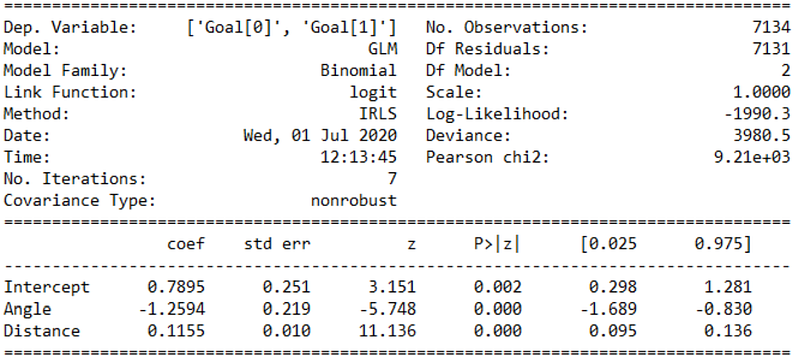
Equation 5 presents the transition model, with σ representing the mean distance between on-ball events, A representing the set of all attacking players, α representing a weight parameter for the PPCF model, and N representing a two-dimensional normal distribution. The authors set σ to 23.9 and α to 1.04, with Equation 3 being normalized to unity. A figure is also presented to validate the logistic regression that was done to build the scoring probability model.
Score Model
In this section, the authors describe the score model, which calculates the probability of scoring from a certain location on the field, given that the ball has been controlled by the attacking team. The authors developed a data-driven model that takes into account both the distance and angle between the player and the goalposts, as both variables have a strong relationship with the conversion ratio. They used non-header shot data from an entire Premier League season to calculate the goal angle and distance and fit the best curve that describes the data using logistic regression.
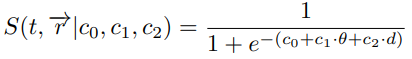
The logistic regression equation includes variables for the angle and distance, as well as values for c0, c1, and c2 that maximize the log-likelihood function. However, the model overestimates the probability of scoring from headers since it was built on non-header shots, and headers have a lower conversion rate than regular shots. Overall, the score model provides a way to predict the probability of scoring from a particular location on the field, which is useful in analyzing and optimizing attacking strategies.
Final Probability
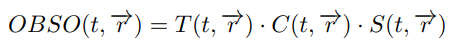
In this section, the authors describe the calculation of the final probability of scoring from a target position on the field at a given time, which is the combination of the three conditional probabilities calculated in the previous sections. The authors use Equation 7 to calculate the final probability, where T(t, r ) is the transition probability, C(t, r ) is the control probability and S(t, r ) is the scoring probability. To visualize each of the intermediate probabilities, the authors break down the field into square cells forming a 32 x 50 matrix and calculate the conditional probabilities for each cell. The authors then multiply these probabilities to obtain the final probability for every point on the field.
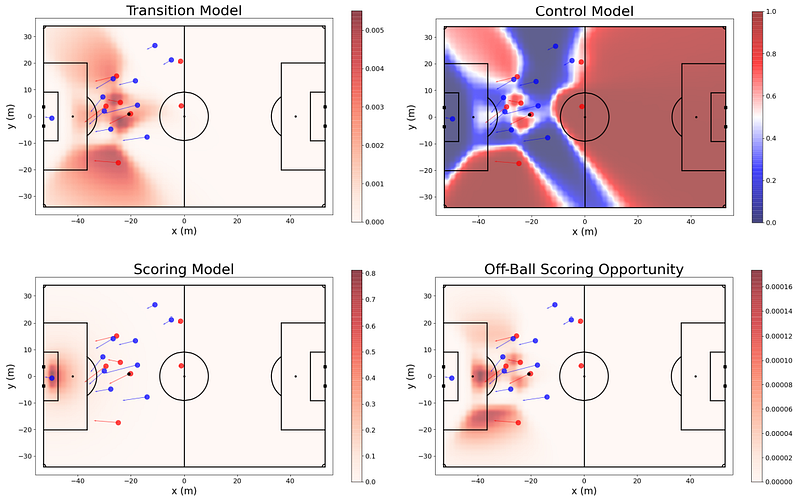
Figure 3 illustrates this process, with the Transition Model showing where the ball is most likely to go next, the Control Model showing which team would control the ball if it moved there, and the Scoring Model showing the likelihood of scoring from a certain location. The Off-Ball Scoring Opportunity model combines all of these probabilities. The authors note that this analysis does not take into account the dynamics of the game, such as changes in player positions and team strategies, which could affect the probabilities calculated.
OBSO Space-Integration
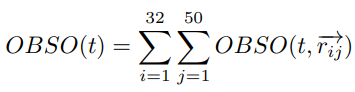
In this section, the authors introduce the OBSO space-integration method for calculating the total probability of scoring after the next action on the ball. This method integrates through every point on the field at a specific time to calculate the probability. Equation 8 is given to describe the OBSO space-integration, which is another form of writing Equation 1 and Equation 2.
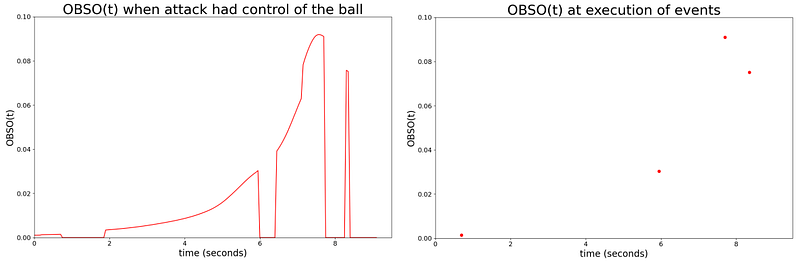
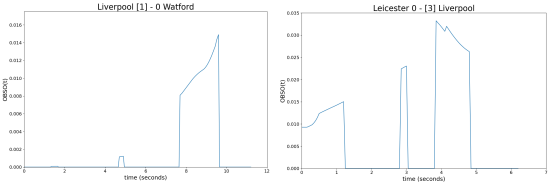
To visualize the results of the OBSO space-integration method, the authors provide Figure 4, which shows the OBSO(t) function for each approach. The left plot demonstrates the approach used in this work, which yields a time-series where OBSO(t) = 0 when the attack is not in control of the ball. In contrast, the right plot shows the original approach, which has a significantly smaller granularity of data.
OBSO Time-Integration
In this section, the authors discuss the OBSO time-integration approach and how it differs from the original approach used by Spearman. The original approach only considers the snapshot of the game at the timestamp in which the events happen. However, by calculating the OBSO for every timestamp an attacking player has control of the ball, we can have a deeper understanding of the attacking opportunity in terms of both collective space creation and player decision-making. The authors manually tagged the timestamps in which players had an on-ball touch and when the ball was not controlled by anyone. After calculating the OBSO for every on-ball touch, the authors perform an integration of those values over time.
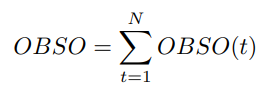
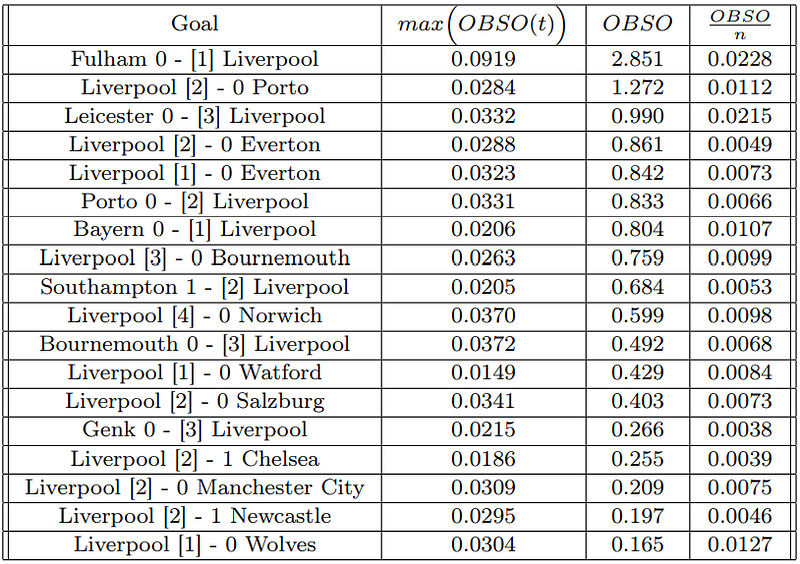
The equation is similar to the original approach, but over more data points. The obtained OBSO total is the cumulative sum of the OBSO value in every timestep. The authors note that the predictive property of the OBSO metric is lost when doing the integration on a larger amount of values, as some attacking opportunities yield values larger than 1, and thus do not represent the probability of the play resulting in a goal. However, it still remains a strong indicator of attacking quality, as plays with a high integration value indicate that good transition options were offered for a larger amount of time. The authors provide a Table II with the values obtained by calculating each of the proposed metrics to every goal used from the dataset.
Results
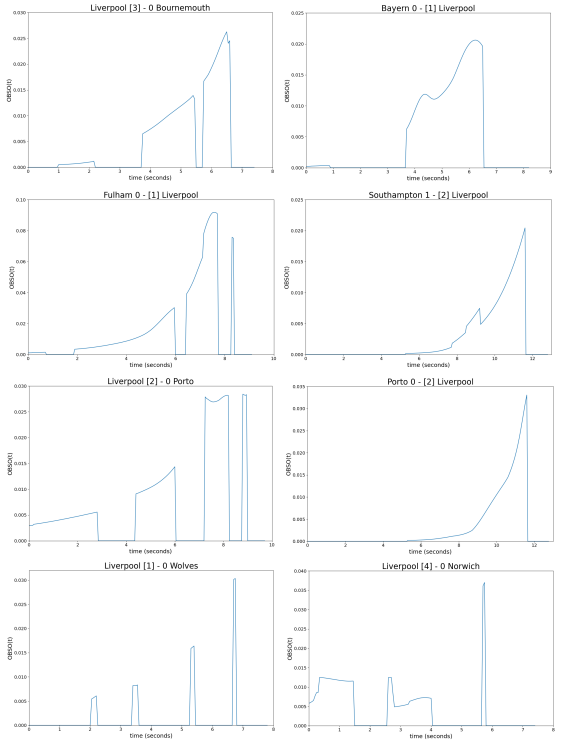
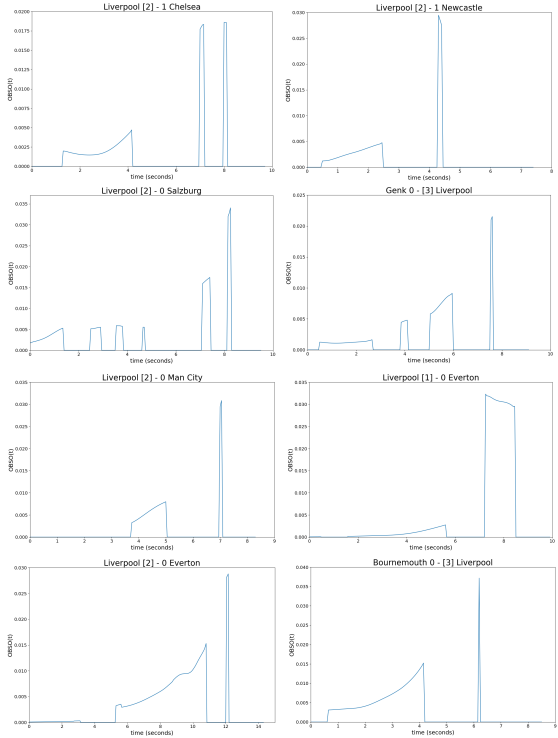
In this section, the authors present the results of their analysis of attacking opportunities using the OBSO metric. They first provide the OBSO time-series for each of the goals in their dataset. Then, they evaluate these attacking opportunities using three different metrics derived from the OBSO time-series: the maximum value of OBSO for each goal, the time-integrated OBSO function, and the mean OBSO value for the time an attacking player was in control of the ball. These metrics provide a better understanding of the quality of the attack, taking into account factors such as the duration of the attack and the amount of time the ball was in control of the attacking team.
The first metric, which gives the maximum value of OBSO(t), allows for a comparison of how much better one play was in comparison to another when the scoring chance was at its highest. The second metric, which gives the time-integrated OBSO(t) function, is also a good comparative measure, as it takes into account the duration of the attack and the time the ball was in control of the attacking team. Finally, the third metric, which gives the mean OBSO value for the time an attacking player was in control of the ball, can contribute to the evaluation by considering the scoring probability during those moments when the ball stayed on the players’ feet for a short amount of time.
The authors present the results of their analysis in Table 2, which displays all the results ordered by the second proposed metric. Additionally, Figures 4, 5, and 6 display the OBSO time-series for each of the goals, providing a visual representation of the attacking opportunities. These results allow for a deeper understanding of the quality of the attacks and can provide insights into how to improve future attacking opportunities.
Practical Applications
Finally, the practical applications of using OBSO time-series to analyze attacking opportunities are discussed. This modeling technique allows for a more comprehensive understanding of how chances are created through tracking data. It can be useful for coaches when building their team’s attacking strategy and repertoire, as it provides valuable insights into critical moments in a game, player and team performance, and scouting. For example, low crosses across the box have been shown to be effective in creating space for attackers to receive the ball and take a shot. Teams should aim for quality transition options in the concluding stage of a possession, where a teammate will control the ball and take a shot.
The authors also suggest that the Control and Transition models should be used as the basis for future research to predict a near-future state of the game. Combining these two models with a third model that gives value to the measurement of interest, such as scoring, can be used to model any phase of the game. This approach can have practical applications for sports analytics and can provide coaches with valuable information to improve their team’s performance.
References
Rios-Neto, H. M., Meira Jr, W., & Vaz-de-Melo, P. O. (2020). A new look into Off-ball Scoring Opportunity: taking into account the continuous nature of the game. Barcelona Analytics in Sports Tomorrow.


