
Prometheus — Overview
What is Prometheus? — Introduction to Prometheus
TL;DR
Prometheus is an open-source tool used for metrics-based monitoring and alerting. It is a popular and powerful solution for Kubernetes monitoring.
Prometheus was originally built by SoundCloud. Now it is a standalone open source project, maintained by Cloud Native Computing Foundation (CNCF).
Key Points
- It is a very powerful tool for collecting and querying metric data.
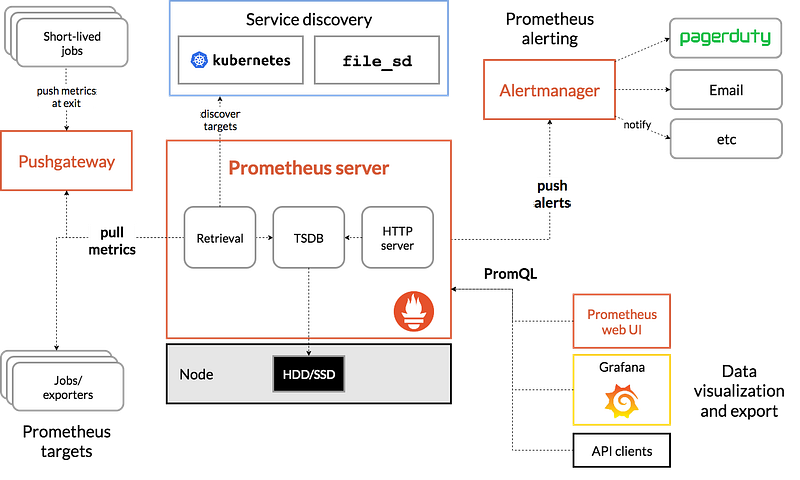
- It works by pulling(scraping) real-time metrics from applications on a regular cadence by sending HTTP requests on metrics endpoints of applications.
- It gives the Client libraries that can be used to instrument custom applications including Go, Python, Ruby, Node.js, Java, .NET, Haskell, Erlang, and Rust.
- It collects data from application services and hosts, then compresses and stores them in a time-series database.
- It offers a simple yet powerful data model and a query language (PromQL), and can provide detailed and actionable metrics that lets you analyze how your applications and infrastructure are performing.
- Properly tuned and deployed Prometheus cluster can collect millions of metrics every second that makes it well suited for complex workloads.
- Prometheus is usually used along side Grafana. Grafana is a visualization tool that pulls Prometheus metrics and makes it easier to monitor.
Why Prometheus?
- Prometheus doesn’t require us to install any custom software or configuration on servers, or even in container images to enable collecting metrics.
- Prometheus doesn’t require our applications to use CPU cycles pushing metrics to some centralized collector.
- Prometheus handles service failure/unavailability gracefully. If a target application goes down, Prometheus can record that it was unable to retrieve data.
- For situations where pulling metrics is not feasible (e.g. short lived jobs) Prometheus provides a Pushgateway that allows applications to still push metric data if required.
- All components of Prometheus can be run in Containers and offers better integration with Kubernetes.
When does it fit?
- Use Prometheus to monitor your servers, VMs, databases, and to analyze the performance of your applications and infrastructure.
- If you’re primarily collecting and evaluating metrics, Prometheus works well for recording any purely numeric time series.
- It fits for both machine-centric monitoring as well as monitoring of highly dynamic service-oriented architectures.
- In a world of microservices, its support for multi-dimensional data collection and querying is a particular strength.
- Prometheus is designed for reliability, to be the system you go to during an outage to allow you to quickly diagnose problems. Each Prometheus server is standalone, not depending on network storage or other remote services.
When does it not fit?
- If you need 100% accuracy, such as for per-request billing, Prometheus is not a good choice as the collected data will likely not be detailed and complete enough.
Alternatives
- Amazon CloudWatch
- Azure Application Insights
- NewRelic and many more
Most monitoring systems use a pushing mechanism where clients (applications /servers) are responsible for pushing their metric data to a centralized collection platform (server). In contrast to a “push” mechanic system, Prometheus is relying on targets (applications/servers) providing simple HTTP endpoints that its data retrieval workers can pull/scrape from.
Summary
Prometheus is a very powerful monitoring system, designed from the ground up to support and work with dynamic environments. Prometheus has gained a reputation as the de facto monitoring software in recent times. Its ease of use, versatility and literally endless integration options make it a favorite in the monitoring and alerting world.
View more from DevOps Mojo
- Kubernetes — Difference between Deployment and StatefulSet in K8s
- Terraform — Overview
- Terraform — Remote States Overview
Happy Learning!!!


