avatarAlexzap

Summary

The article outlines the process of creating a Python-based stock market web application using Plotly Dash, which includes interactive visualizations of NVIDIA stock prices and technical indicators.

Abstract

The post details the deployment of a Plotly Dash stock market app that visualizes user-defined stock prices with technical indicators from the TA library. It guides readers through a five-step workflow: retrieving stock data for a chosen ticker symbol (NVDA) using the yfinance API, adding moving averages, incorporating volume, MACD, and stochastic oscillator data, saving the stock chart as an interactive HTML file, and implementing the Dash app with live stock data and various indicators. The app benefits from the Dash framework's interactive features without the need for JavaScript, offering a user-friendly interface with dropdowns, sliders, and real-time graphs. The article emphasizes the advantages of using Plotly for creating interactive visualizations and the convenience of the dashboard layout over traditional Jupyter notebook cells.

Opinions

  • The author values the interactivity and modern UI elements provided by Plotly Dash for web applications.
  • There is a preference for exporting Plotly figures to HTML for browser-based interactivity, such as hovering over data points and manipulating the graph.
  • The dashboard layout is favored for its ability to consolidate multiple charts into a single, cohesive view, enhancing the user experience.
  • The article suggests that deploying Dash apps to a server using Dash Enterprise is the preferred method for sharing the app with others.
  • The author encourages further exploration into Python for finance applications, as well as the deployment and use of Dash apps for trading strategies and stock screeners.

Plotly Dash TA Stock Market App

Photo by Anne Nygård on Unsplash
  • The objective of this post is to deploy a Plotly Dash stock market app in Python using the dashboard of user-defined stock prices with popular technical indicators available in TA.
  • Read more the tutorial on plotting stock price chart along with volume, MACD & stochastic.
  • The entire workflow consists of the following 5 steps:
  • Step 1: Select a stock ticker symbol (NVDA) and retrieve stock data frame (df) from yfinance API at an interval of 1m
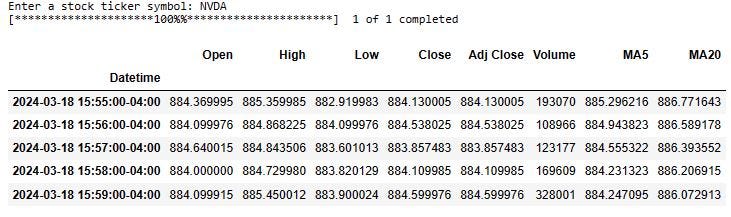
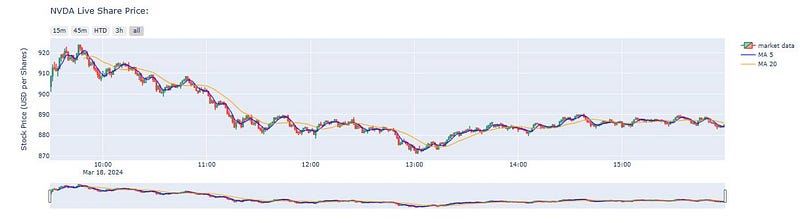
  • Step 2: Add Moving Averages (5day and 20day) to df and plot live share price
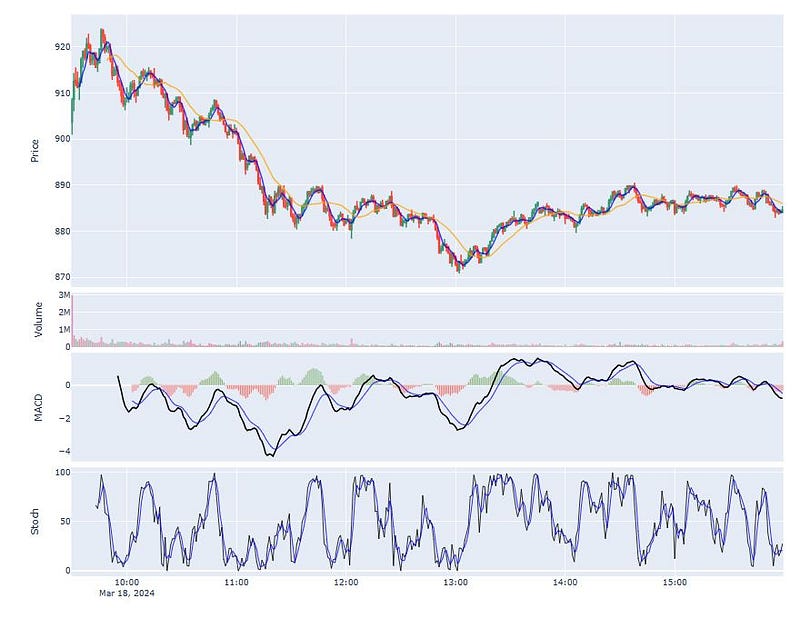
  • Step 3: Add Volume, MACD, and Stochastic Oscillator from TA
  • Step 4: Save our stock chart in HTML form, which means all the interactive features will be retained in the graph
  • Step 5: Implement the Plotly Dash app containing live NVDA stock prices with MA 5–15–50–200, Volume, RSI, and MACD.

Summary

  • In this post, we have used Plotly to generate interactive visualizations of NVIDIA stock prices and basic technical indicators from TA
  • The Plotly Dash framework has been employed for building web app with the added benefit that no JavaScript is needed.
  • Plotly Dash provides increased interactivity and the ability to manipulate data with modern UI elements like dropdowns, sliders and real-time graphs.
  • Plotly figures are interactive when viewed in a web browser: we can hover over data points, pan and zoom axes, and show and hide traces by clicking or double-clicking on the legend. We have exported them to HTML files which can be opened in a browser.
  • The most significant benefits include our preference for the dashboard layout of all of the charts instead of separate cells of the Jupyter notebook.
  • By default, Dash apps run on localhost. To share a Dash app, we need to deploy it to a server using Dash Enterprise.

Explore More

Python
Stock Trading
Apps
Dashboard
Plotly
Recommended from ReadMedium