
Python: Build a Program to Retrieve and Graph Live Stock Market Data
In this article I am going to utilize the new yahoo finance API to write a program that will retrieve live stock market data and display it using Python and Plotly — All for free!

In this article I will show you how to get live stock market data, for any stock of your choice, without calling expensive APIs or needing to pay for access. To do this, I will be using popular python packages that can all be installed using PIP.
Source(s):
How to Get Live Market Data (Less Than 0.1-Second Lag):
Before We Get Started:
To get the results seen in this article, you will need to have installed on your device the following packages:
- Yfinance
- Pandas
- NumPy
- Plotly (Can use alternative, but useful for plotting results)
If any of these packages are not already installed you can use PIP commands to install them in your command window as follows:
pip install yfinance
pip install pandas
If you are new to python, you might not be familiar with pip installer. Here, I have linked a guide to installing pip on windows.
Once these packages are installed, we can begin creating our program.
I. Import Packages
The first step is to import the aforementioned packages.
You can import these packages using the following lines of code:
Once the required packages are imported, we can begin utilizing them to retrieve market data.
II. Specify Which Stock We Wish To Graph (Ticker)
With the yahoo finance API and pandas data reader we can write code that will allow us to import data from any publicly traded stock symbol.
- First, we will need to override yahoo finance api
yf.pdr_override() - Next, we will need to create an input field for us to input our desired stock symbol. By setting variable ‘stock’ equal to the input, we can utilize the stock variable to be the specified symbol. This will allow us to query yahoo finance api for our desired data.
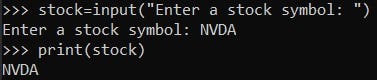
stock=input("Enter a stock symbol: ")
print(stock)- Running the above lines of code will ensure that python recognizes the stock variable and the output should be whatever ticker symbol you put in.
III. Retrieve Market Data for our Desired Stock
In order to retrieve data from the Yahoo Finance API we will need to make several arguments to specify what data we are trying to receive.
Yahoo Finance API requires the following 3 mandatory arguments in this order:
- Ticker
2. Start-Date + End-Date or Period
3. Interval
- To call your data you will need to use the following syntax
yf.download(tickers=argument1, period=argument2, Interval=argument3)Since we have created a variable ‘stock’ to hold our stock name, we can utilize the above function to gather data from a certain stock according to the specified period and interval amounts requested:
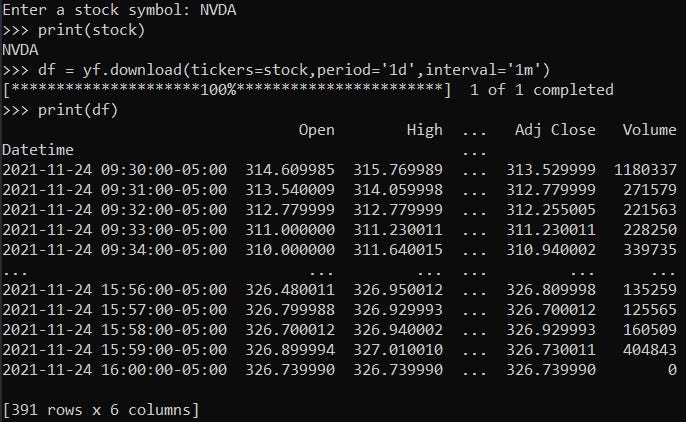
To summarize, the above command is calling Yahoo Finance API for the specified stock for a period of 1 day and at an interval of 1 minute.
- The output is as follows with the NVDA example:
Now that we know the commands work, let’s try to test our program by re-running it and entering a new stock symbol. For an easier way to compile and run your code, I highly recommend Visual Studio Code which is an IDE for many different languages, and can help run your program continuously.
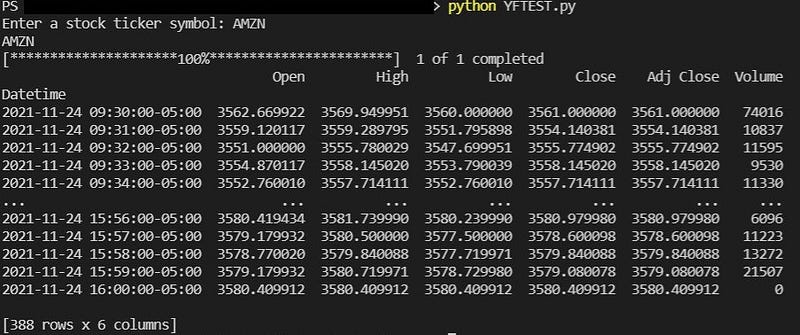
- If you are saving your file, you can run it in a command window using the following:
python YOUR_FILE_NAME.py- When running our program and entering symbol ‘AMZN’ the following returns:
Now that we have access to our data, let’s graph it
III. Visualizing Our Data
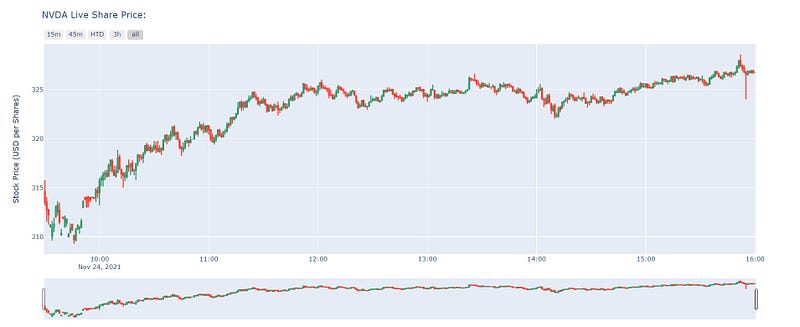
In order to visualize our data we will need to declare and set up our graph. This can be done using Plotly with the following code:
- There are numerous ways to visualize this data and I highly suggest you play around with what’s available to get your optimal result.
- The output:
Source(s):
(1) How to Get Live Market Data (Less Than 0.1-Second Lag):
(2) Learn algorithmic trading in one day:
https://www.udemy.com/course/python-for-algorithmic-trading/
Full Code:


