
A four-part series.
Part 4 Deployment — Build and Monitor an Affordable Battery-Solar System with a Raspberry Pi
Build a capable battery-solar system with energy flow monitoring for less than £150… Oh, and have fun!

Series
This series is organised into four parts. If you’re new here, I suggest starting with Part 1 for some context.
Part 1
An introduction to solar power, hardware parts list, and system specification.
Part 2
An overview of the circuit concepts, the system schematic, and building of the system.
Part 3
A deep-dive into the software used in the system.
Part 4
The detailed deployment steps for the Raspberry Pi.
Previously in the guide series, we discussed the physical hardware details of the electrical system and took a deep-dive into the code. So, now with the assumption that the electrical system is setup and we understand the code we’ll need, we turn our attention to deployment. We’re so close I can almost taste it!
Since there are a lot of steps to deploying this system, I’ll keep it concise and won’t detail everything. Rather, I’ll give pointers on the parts I found trickier and provide the (excellent) resources I used. This is a learning experience after all!
This part of the guide wraps all these resources into a useful order to help us to deploy this system and to get up and running! There’s a diverse array of skills to showcase here, from database configuration and Linux competency, to scheduling tasks and data visualisation. Anyway, enough of the talk —it’s time to walk the walk.
Steps
Let’s first consider the main things we’ll need to do on the Raspberry Pi in a rough chronological order:
- Install Raspberry Pi OS and update
- Setup SSH access
- Enable Git(Hub) access
- Install and setup InfluxDB
- Install Grafana
- Install the Python packages
- Configure and Test Python code
- Connect InfluxDB to Grafana and create users and dashboard
- Setup Rclone to mount the Google Drive directory
- Setup Cron Jobs for
reboot.sh,reboot1.shandmidnight.sh
Seems reasonable, right? Good, now we’ll explore each ‘step’ in more detail.
Raspberry Pi OS and SSH
The Raspberry Pi has its own supported OS, based on the Debian flavour of Linux (called Raspberry Pi OS, who’d have guessed?). Note that when I mention Raspberry Pi, I’m referring to the Raspberry Pi Zero W in this case, but this shouldn’t make any difference.
To install it, the steps we need to do here are as follows:
- Install the ‘Lite’ RPOS version to the SD card using the Raspberry Pi Imager — this just means that it has no desktop environment. So, instead, we’ll access it via SSH (Secure Shell) on another computer, meaning we don’t have to connect a screen or any peripherals to the Raspberry Pi.
- Ensure that SSH is enabled on the Raspberry Pi — read the NOTE and WARNING sections at the link for headless setup.
- Ensure that it can automatically connect to WiFi when it boots up for the first time.
- Enable passwordless access — (optional) this generates an SSH key on your personal computer that you’ll use to access the Raspberry Pi without having to provide the username and password each time. If you choose not to do this, make sure you change the default password.
So far, so good. Once you’ve inserted the SD card and the Raspberry Pi has booted up for the first time, we should be able to SSH into the Raspberry Pi with a Linux command like ssh raspberrypi.local or ssh pi@<IP> (replace
Next, we’ll update and upgrade the RPOS to make sure it’s running the latest version with sudo apt update, then sudo apt full-upgrade.
GitHub
We’ll use Git, specifically GitHub, to contain, organise and transfer all of our source code to the Raspberry Pi. This means we can write/edit the code as we normally would on our personal computer, git push to GitHub, and git pull from GitHub on the Raspberry Pi to load the versioned files.
To set the Raspberry Pi up with GitHub and connect it to our own GitHub account, the steps are as follows:
- Ensure you have Git installed on the Raspberry Pi with
sudo apt install git— it should already come installed with git as part of the OS, but it’s always good to check! - Configure Git to authenticate via SSH — first check if you have an SSH key on the Raspberry Pi, generate one (if you don’t), add it to your GitHub account, then test the connection. This lets you access and perform actions with your GitHub account via the command line without having to enter your username and personal access token at each visit (similar to SSH passwordless access for the Raspberry Pi, of course).
Now we can Fork the Github repo, and pull the code we’ll need into the root directory of the Raspberry Pi using SSH.
That’s all for GitHub. This will enable us to perform Git commands in the bash scripts, and simply allow us to grab source code quicker without having to enter username and password each time!
Install InfluxDB
This is where it starts getting juicy — databases mean business!
InfluxDB offers an open-source time-series database which is ideal for our use-case here, with multiple sensors and data-points being measured and posted to the database at regular time intervals. They also offer a cloud product with a free tier if you want to play around with a hosted database.
In this guide, we’ll install InfluxDB v1.8.5 (I know, v2.0 was released recently) since I have implemented and tested v1.8.5 in my setup (and I believe v2.0 requires a 64-bit operating system, which we have not installed). I did upgrade to v1.8.9 (the most recent v1.8.x) but had startup issues, so had to downgrade back down to v1.8.5 — I recommend you stick with v1.8.5 for this guide.
So, to install InfluxDB v1.8.5 (Debian), we run:
wget -qO- https://repos.influxdata.com/influxdb.key | gpg --dearmor > /etc/apt/trusted.gpg.d/influxdb.gpgexport DISTRIB_ID=$(lsb_release -si); export DISTRIB_CODENAME=$(lsb_release -sc)echo "deb [signed-by=/etc/apt/trusted.gpg.d/influxdb.gpg] https://repos.influxdata.com/${DISTRIB_ID,,} ${DISTRIB_CODENAME} stable" > /etc/apt/sources.list.d/influxdb.listWhich adds the InfluxData repository for the key (these commands are taken directly from their installation page). Then, we install and start the service using the file download method (but using v1.8.5):
wget https://dl.influxdata.com/influxdb/releases/influxdb_1.8.5_armhf.debsudo dpkg -i influxdb_1.8.5_armhf.debsudo systemctl unmask influxdb.servicesudo systemctl start influxdbsudo systemctl enable influxdb.serviceNow, we’ll create two databases — pi_energy and pi_energy_3_year. pi_energy will have a retention policy of 2 weeks, and a continuous query will run every 15 minutes to reduce and average the granular 3-second data over 15 minutes. It’ll then insert this data into the pi_energy_3_year database (which has a retention policy of 3 years) so we have a less granular but long term overview of the system. I’ve chosen to keep the granular and reduced data in two different databases for better data separation and redundancy.
We’ll set up the continuous queries and retention policies once we’ve inserted some data into the database for the first time using the Python main.py script. For now, we’ll create the databases and the user we’ll need.
We connect to the InfluxDB shell with:
influxThen create the pi_energy and pi_energy_3_year databases with:
create database pi_energy
create database pi_energy_3_year
Then create a user called piscript (or whatever you want) which will be able to insert data to the database from the python script — making sure you insert your own password in place of <passwordhere>:
create user piscript with password '<passwordhere>' with all privilegesNow, we’ll assign these user privileges to both databases, first by ‘selecting’ the database with the use command, then applying the privileges:
use pi_energy
grant all privileges on pi_energy to piscript
use pi_energy_3_year
grant all privileges on pi_energy_3_year to piscriptOf course, granting all privileges means that this user has full control of the database. If you’d rather restrict this, you can restrict to either READ or WRITE for non-admin users.
The measurements (database tables) will automatically be created through the python script for pi_energy (energy_system2) and through the continuous query for pi_energy_3_year (energy_system2).
Great, we’ll come back to InfluxDB later to set the retention policies and continuous query out.
Take a moment to appreciate how far we’ve come 🏖️!
Install Grafana
Grafana offers an open-source data-visualisation tool used to create your own custom dashboards with the data you need easily accessible.
This is how we’ll view all the data that we’re measuring — you saw a glimpse of it in Part 1 of the series! I’m running v7.4.0 since this was the most recent version when I set my system up. v8.1 is the current version which includes some cool new features. I recommend installing the latest version since there shouldn’t be any breaking changes, but revert to v7.4.0 if you have any trouble.
Their tutorial describes the installation process for Raspberry Pi very well, so check it out and rendezvous back here when you’re done. The process is similar to InfluxDB. First add the APT key and repository used to authenticate packages, then install Grafana and enable and start the server. See the tutorial for convenient CLI commands!
You’ll then just need to login to Grafana on your personal computer at <Raspberry Pi IP>:3000 (username: admin, password: admin). Change the default admin password on the user profile found in the bottom left corner of the interface!
We’ll come back to Grafana later to connect the data source (InfluxDB), and configure the dashboard(s).
We’re getting the hang of this now!
Python Packages
I’m using Python 3.7 to run main.py, but it should work with the latest Python version. So, to install the latest stable Python 3.x version (try this first), use:
sudo apt-get install python3Or, to install Python 3.7 (if you’re having compatibility problems with the packages, perhaps), use:
sudo apt-get install python3.7Next, we’ll install the package manager (pip3) to use to install the Python packages for the main.py script:
sudo apt-get install python3-pipNow we can install all the Python packages we’ll need for the main.py script:
pip3 install gpiozero
pip3 install influxdb
pip3 install pi-ina219
pip3 install psutil
pip3 install Adafruit-DHT
That’s it for the Python packages — on to the code!
Configure and Test Python Code
It’s time to put what we’ve done so far to the test by inserting our first measurements to the database! First we’ll add the username and password of the InfluxDB user that we created earlier into the main.py script. You may remember this section of main.py:
# influx configuration
ifuser = ""
ifpass = ""
ifdb = "pi_energy"
ifhost = "localhost"
ifport = 8086
measurement_name = "energy_system2" # influxdb measurement table
We need to add the ifuser and ifpass parameters. This can be done on the Raspberry Pi using the Vi or Nano editor, or simply by updating it on your personal computer and pushing the changes to the Raspberry Pi via GitHub.
If you have used the same database names used so far, and kept the default InfluxDB port, nothing other than ifpass needs to be changed in main.py. So, now it’s time to run main.py for the first time! Navigate to it’s directory and run this command:
python3 main.pyIf you get an overflow error, make sure you’ve set the Raspberry Pi up correctly according to the schematic in Part 2. There’s a chance that the shunt wires may have disconnected or are not making enough contact. If you get no command line output, that’s good! I removed print statements so it’s production ready. Let’s check that we’re inserting some values into the database and that they look reasonable:
influx
use pi_energy
SELECT * FROM energy_system2 LIMIT 5
We should get something like this:
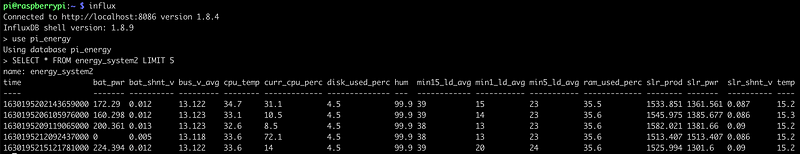
© Seb HulseFantastic, our code works! All we have to do now is to make it pretty in Grafana, and set up the automation!
InfluxDB and Grafana Configuration
We’ll jump back into InfluxDB to set the retention policies and continuous query now that we have some fields and values in our energy_system2 measurements table.
The continuous query is set using the following command:
influxuse pi_energyCREATE CONTINUOUS QUERY "cq_15m" ON "pi_energy" BEGIN SELECT mean("bat_pwr") AS "mean_bat_pwr", mean("bat_shnt_v") AS "mean_bat_shnt_v", mean("bus_v_avg") AS "mean_bus_v_avg", mean("cpu_temp") AS "mean_cpu_temp", mean("curr_cpu_perc") AS "mean_curr_cpu_perc", mean("disk_used_perc") AS "mean_disk_used_perc", mean("hum") AS "mean_hum", mean("min15_ld_avg") AS "mean_min15_ld_avg", mean("min1_ld_avg") AS "mean_min1_ld_avg", mean("min5_ld_avg") AS "mean_min5_ld_avg", mean("ram_used_perc") AS "mean_ram_used_perc", mean("slr_prod") AS "mean_slr_prod", mean("slr_pwr") AS "mean_slr_pwr", mean("slr_shnt_v") AS "mean_slr_shnt_v", mean("temp") AS "mean_temp" INTO "pi_energy_3_year"."autogen"."energy_system2" FROM "pi_energy"."autogen"."energy_system2" GROUP BY time(15m) ENDI know, I know… It’s a beast. Let’s break it down a bit…
We create a continuous query named cq_15m which takes each field from the energy_system2 measurement table in the pi_energy database, and averages (takes the mean of) it over 15 minutes. It then creates a new measurement table in pi_energy_3_year named energy_system2 and inserts each averaged field value under a new name with mean_ prefixed (e.g. bat_pwr in pi_energy corresponds to mean_bat_pwr in pi_energy_3_year). That’s it!
Now, we’ll set the retention policies. These are considered good practice and are intended to limit the size of the database so they don’t become unmanageable. I’d recommend setting a retention policy on the granular pi_energy database, but the 3 year policy on the pi_energy_3_year is optional. Consider that the granular 3-secondly data amounts to 28,800 database rows added per day, whereas the 15-minutely reduced data amounts to just 96 rows added per day (300x less). As a reference, a full backup of my 10 month dataset is approximately 38MB — that’s 2 weeks of pi_energy data, and 10 months of pi_energy_3_year data.
To set the 2 week (336 hours) retention policy on pi_energy, we use this command:
influx use pi_energyCREATE RETENTION POLICY "rp_336h" ON "pi_energy" DURATION 336hSetting the 3 year policy on pi_energy_3_year would be a similar story if you choose to do so.
Awesome! Now we have all of the data in place to be able to connect it to Grafana.
First, log into the user (or admin) profile that you created before at <Raspberry Pi IP>:3000 on your personal computer. Then, go to Configuration > Data Sources in Grafana.
Remember, we have two data sources to connect since we have two databases. Starting with pi_energy, weAdd data source , select the InfluxDB type option, and configure the settings to resemble this:
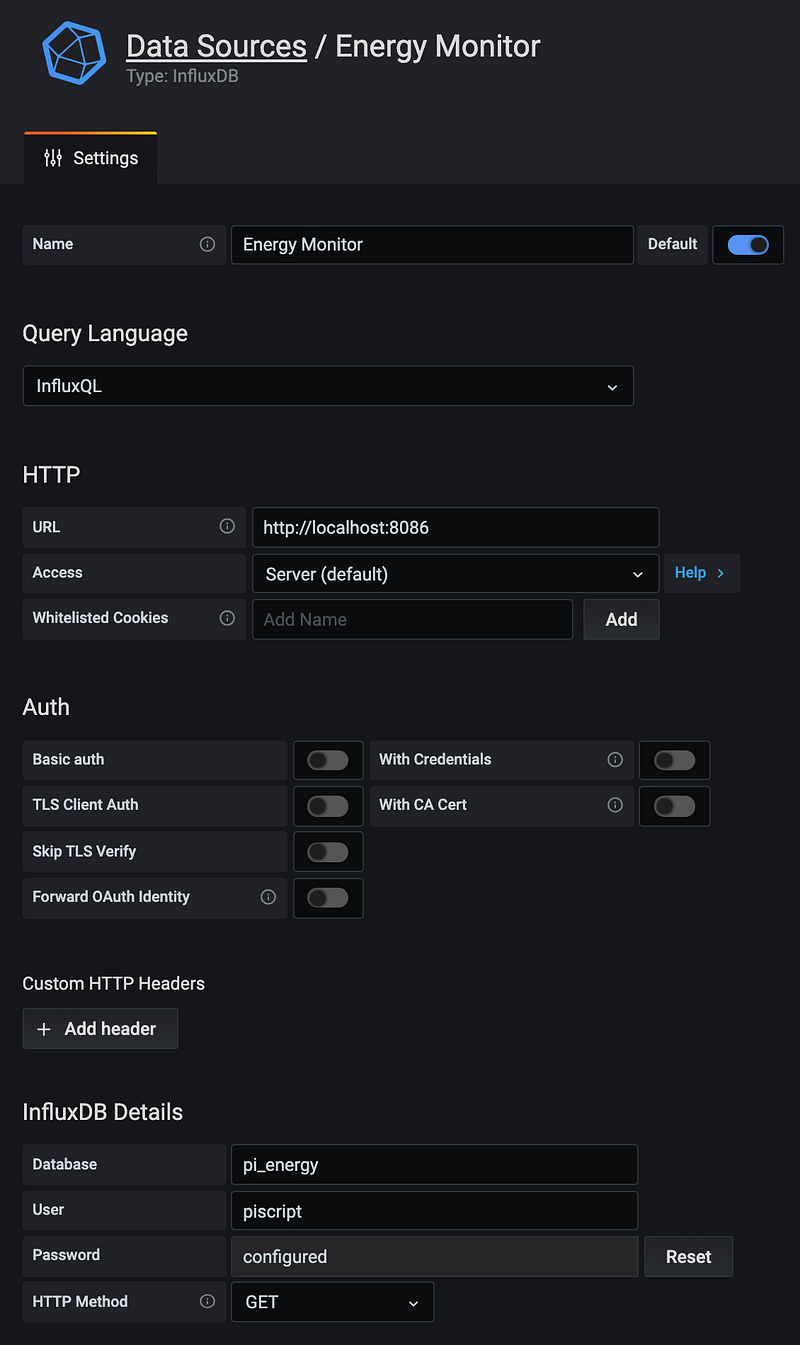
Setting the Name, Query Language, URL, Access, Database, User, Password, and HTTP Method fields. Then, just Save & Test and rinse and repeat for the pi_energy_3_year data source, setting the Name to Energy Monitor Longterm and de-selecting the Default option.
Nice. Data sources sorted. Now, you could go ahead and configure the dashboard(s) however you like. As a starting point, I recommend you import the templates (energy_monitoring.json and energy_monitoring_longterm.json) I’ve provided in the GitHub repo, and configure them from there. Have a nosey at how the data source queries are structured for each panel by editing them — you should find something like this:
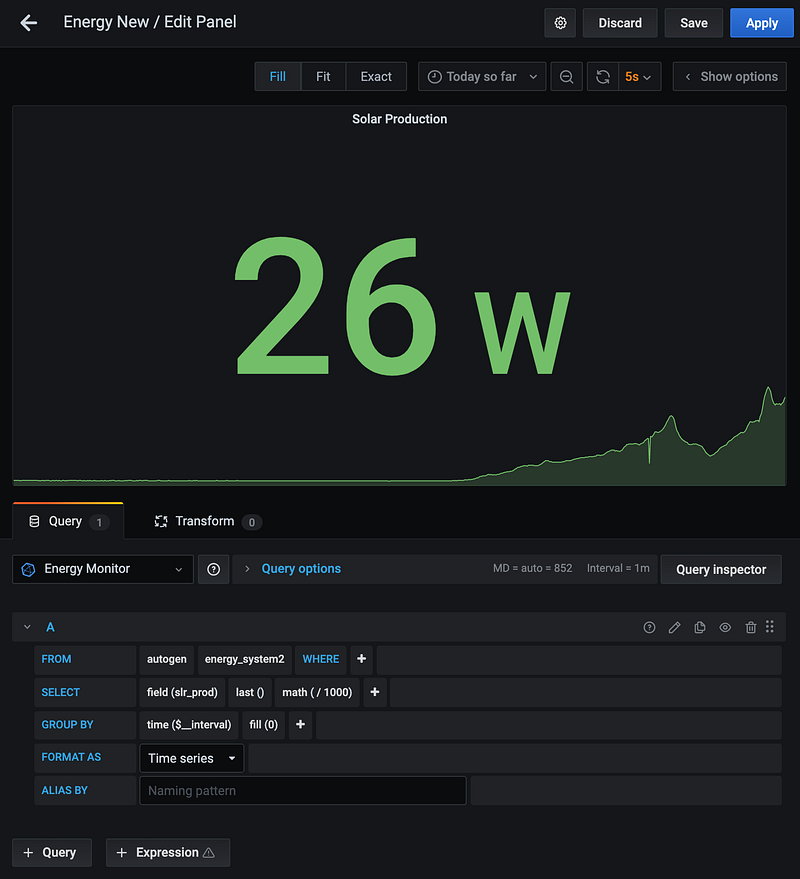
Here, the energy_system2 measurement is being accessed through Energy Monitor (pi_energy), then autogen, and finally energy_system2. The field is slr_prod in this case, and the value is divided by 1000 to convert from milliwatts to Watts with math(/1000).
You can change the time interval using the handy dropdown box in the top right corner of the dashboard:
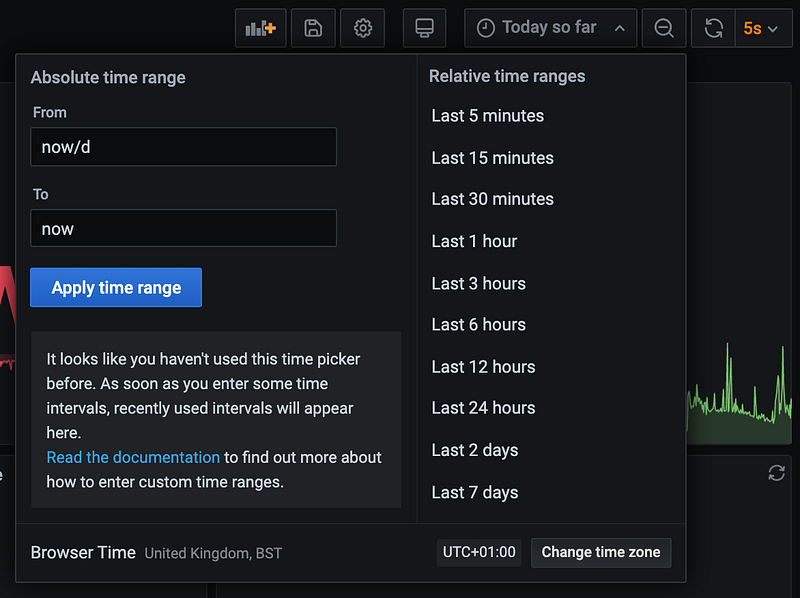
Note — if you don’t see the data from the longterm dashboard immediately, remember that the continuous query runs every 15 minutes. There won’t be any data in this database until at least this time has passed from continuous query setup.
Learn more about building Grafana dashboards so you can build and edit to your heart’s content.
Now we’re getting somewhere — so many colourful boxes! All thats left to do is to set the backup up and configure the automation!
Rclone
Rclone is an open-source project allowing effective management of files on cloud storage. We’ll use it to mount a remote Google Drive directory in this example, but feel free to use your preferred cloud provider — Rclone supports a lot of them.
The aim of this section is to create a mounted gdrive directory named InfluxDB-Backup for backing the InfluxDB databases to. This is a simplified file structure from the root directory:
.
└── mnt
    └── gdrive
        └── InfluxDB-Backup
This is the fantastic guide that I used to mount the Google Drive on my Raspberry Pi — follow that up until the Automatically Mounting Google Drive section and we’ll regroup here afterwards. Thank you Artur Klauser!
The purpose of our reboot1.sh script is to mount the gdrive directory on startup using Cron Job tasks. This is an alternative to configuring Systemd, which I found to be inconsistent.
With that said, it’s time to set the Cron Job tasks up.
Cron Job Configuration
We’re on the home straight! Just one more little section to go!
Cron is a utility program on Linux based systems that lets users input commands for scheduling tasks at specific times, time intervals, or at predetermined events. It runs on the Cron daemon to allow the commands to be run in the background without user intervention.
As mentioned, we’ll use Cron Job tasks to schedule the midnight.sh, reboot.sh and reboot1.sh shell scripts. To configure Cron Job tasks, we edit the crontab file in Raspberry Pi OS and add the Cron commands. The commands we need are included in line 3 of each of the shell scripts.
To access crontab, navigate to the root directory and use this command:
crontab -eThis will open the file for editing in your default text editor. We want to amend this file to look something like this:
SHELL=/bin/bash
PATH=/usr/local/sbin:/usr/local/bin:/usr/sbin:/usr/bin:/sbin:/bin:/usr/local/games:/usr/games
0 0 * * * bash /home/pi/battery-solar-rpi/midnight.sh >> /home/pi/battery-solar-rpi/logs/midnight_cron.log 2>&1@reboot bash /home/pi/battery-solar-rpi/reboot.sh >> /home/pi/battery-solar-rpi/logs/reboot_cron.log 2>&1@reboot bash /home/pi/battery-solar-rpi/reboot1.sh >> /home/pi/battery-solar-rpi/logs/reboot1_cron.log 2>&1SHELL and PATH set the paths to the relevant execution programs and packages.
The schedule can be changed, so if you’d like to run the backup at a different time, for example, you can use this excellent tool to help determine what Cron scheduling expression you’ll need. Note how we’re directing the standard output to the corresponding log file for each script.
Then, just save and quit the editor, reboot the Raspberry Pi, and you’re done! Check to see if the main.py script is running with the command htop (after the Raspberry Pi has had a few minutes to start up). If so — check to see if you’re getting new values in your Grafana dashboard! If your Grafana dashboard is updating as it should be, congratulations! You’ve set up a whole energy monitoring system on Raspberry Pi! If not, work backwards by checking Grafana, InfluxDB database values and the Cron Job logs for any error messages etc.
Conclusion
Heck! What a ride. I know this deployment section was a particularly chonky one, but we made it! Let me know in the comments what you thought of the process.
All-in-all, we’ve set up a killer battery-solar system for a fraction of the price of the off-the-shelf alternatives. It has all the monitoring and insights we could ever need to be able to effectively manage the sun’s power and charge all of our devices. With all the ground-work we’ve put in, there are infinite opportunities for improving on this system. How about adding some relays to the system to trigger additional electronics (fans?) to turn on or off depending on temperature or the amount of power currently being generated? Or optimising your power generation by experimenting with solar panel placement? Or even hosting your database online and being able to see your generation insights from all over the world?
Whatever you choose, make sure to make the most of your wonderful near-zero carbon energy, and your beautifully coloured boxes on your Grafana dashboards. I find it very satisfying to say that I’ve been able to write this series (as well as doing everything else over the last 10 months) almost entirely on the solar power that I generated with the system!
Perhaps I’ll write up an analysis of the system at the 1-year milestone — stay tuned!
In the meantime, let me know how you’ve approached your battery-solar system and how its worked out for you — I’d love to see!
Thank you for reading the whole article (and series)! It means a lot to me that you took some moments out of your day to consider my ideas :)
If you’re not a Medium member but have enjoyed reading along, please consider supporting me by subscribing to Medium via my referral link. If you do, I’ll receive a portion of your membership fees and it will enable me to write more articles similar to this one.
Have a great day!