
A four-part series.
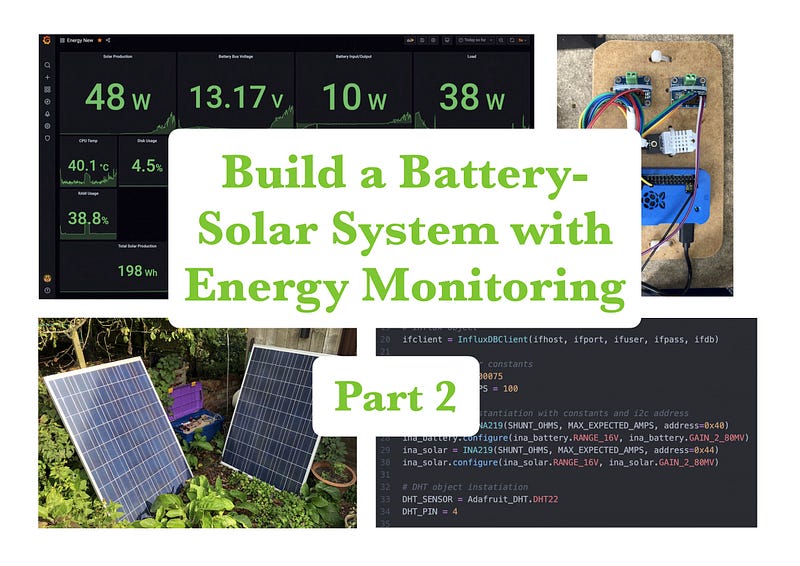
Part 2 Building — Build and Monitor an Affordable Battery-Solar System with a Raspberry Pi
Build a capable battery-solar system with energy flow monitoring for less than £150… Oh, and have fun!
Series
This series is organised into four parts. If you’re new here, I suggest starting with Part 1 for some context.
Part 1
An introduction to solar power, hardware parts list, and system specification.
Part 2
An overview of the circuit concepts, the system schematic, and building of the system.
Part 3
A deep-dive into the software used in the system.
Part 4
The detailed deployment steps for the Raspberry Pi.
In Part 1 of the series we discussed how the system works, the components we need, and detailed how to specify and customise your system to fit your requirements. Now, with the foundations in place (and the shopping list attended to), we’ll provide an electrical schematic, and set about building the system! Let’s start with an overview of system energy measurement.
Circuit Considerations
So then, what are current shunts and why are there two of them on the shopping list?
Great questions. To measure the overall energy flow through the system (and to be able to ultimately display this information in a visually appealing way), we need to consider the three points of input/output to the battery. These will be: Solar charge controller(s) (input), Load (output) and Battery (input & output).
Current shunts enable us to measure current and are simply large resistors with known resistance. Measuring the (small) voltage drop across the shunt means we can calculate the current flowing across it, and hence work out the power travelling through it.
To measure the overall input/output, we need two current shunts to measure the current at two points, and we can use those two measurements to calculate what is happening at the third point (think of it as a triangle). In this example system, we will measure the current at the battery (for input/output, positive or negative current will indicate direction), and we will also measure after the solar charge controllers. For example, if we have a 10A load, and we know that there is also still 5A going IN to the battery, then the solar must be producing 15A (10A+5A). Note that it is also possible to place the shunt before the load instead of after the solar charge controllers. There would be no discernible difference to the measurements after the program is amended slightly.
As an aside, we can measure the bus voltage (battery voltage) using the INA219 sensors and simply multiply this voltage by the current sensed at each of the shunts to calculate Power in Watts. More of this is in Part 3.
Power (W) = Voltage (V) * Current (A)The next section will explain the practicalities of measuring the energy flow of the system.
Hardware Modification
Before we see the circuit diagram — a quick note on how current sensing in the circuit will be achieved, practically. I’ve chosen 100A DC current shunts to allow upgradability to measure large loads through the system in the future (for example with a DC-AC inverter). Of course, you could specify a smaller current shunt in your system if you plan on using smaller loads, which could also save some money (e.g. 10A, 20A, 50A etc).
You may have noticed that the INA219 digital current sensors only support up to 3A current sensing out-of-the-box. That’s correct. Instead of using the INA219 as designed, we need to modify it to use the 100A current shunt in place of the smaller integrated current shunt. Luckily for you, I’ve already written a comprehensive blog post detailing how to do this! This will need to be done twice for the two current shunts we’ll need. Note that the INA219 modules we see in the circuit diagram are the modified versions, modified according to my article.
TL;DR, we’ll desolder the integrated current shunt and connect the 100A current shunt to the INA219 to be able to measure the (very small) voltage drop across the current shunt, which we can then use to measure the current flowing through the 100A shunt (see Circuit Diagram section).
Do check the post out though, the software details will help for later steps!
Circuit Diagram
Heck! That’s a lot to take in… Where do I start?
Don’t panic. We can separate the system into sections by looking at the three different wire thicknesses. The thinnest wire refers to the jumper cables in the shopping list. These are for measurement purposes and will not be carrying much current. If we take this section of the circuit out, for now, we are left with the bare-bones battery-solar system (which would work on its own without the measurement aspect of course… but where’s the fun in that?).
This bare-bones battery-solar system has two thicknesses of wire. In my example system, I don’t expect the amperage of the individual loads or the connections from the solar panels to the solar charge controller to exceed 11 amps (since the output of the panels is ~24V). The nearest usable wire size has a 1mm² cross-section (suitable for 14 amps), which I could’ve used in my system for everything up to 14 amps. However, I was able to get hold of some 1.5mm² cross-section wire for free, so decided to use that for the most part.
For everything above 14 amps (battery to the bus bar and solar output to the bus bar), I used 25mm² cross-section wire since these loads will be less than 92 amps. These are the thickest wires in the circuit diagram.
Considering the wire sizes help us to segment the system and break it down logically. From here, I’ll give an overview of the energy flow in the System Overview.
System Overview
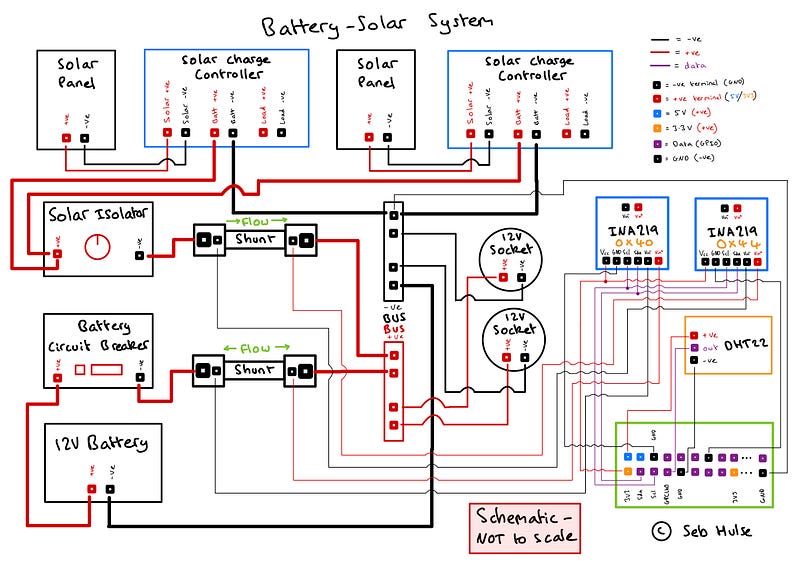
Let’s now consider the flow of energy in the system in the context of the schematic. When the sun is shining, power flows from the solar panels and into the solar charge controllers. These take the higher voltage from the solar panels and transform it into a voltage suitable for the current state of the system (typically 12V-14.4V), taking into account the battery state of charge, and the other inputs and outputs of the system. The output from the solar charge controllers can be isolated at the switch to disconnect solar input to the system. This solar input current flows over a shunt to be measured before reaching the bus bar.
The battery is connected to the bus bar via a circuit breaker and shunt and enables bidirectional energy flow. The loads are connected through the 12V cigarette lighter sockets which are connected to the bus bar (see Hardware Setup for discussion).
The two INA219 modules measure the (very small) voltage drop over their respective shunts and calculate the current from this (see Hardware Modification or my detailed article). They also measure bus (battery) voltage so power can be calculated in Watts. This data is then logged by the Raspberry Pi, along with the information from the DHT22 (temperature and relative humidity) — but you’ll have to wait in suspense until Part 3 for the software details!
Hardware Setup
With all the theory under our belts, we can now get our hands dirty! A quick note before we do though — you may have noticed that the schematic is a bit light on fuses and isolators. This is true, ideally, we would have fuses (a fuse box is even better) to manage each of the loads in the system (e.g. 12V cigarette lighter sockets, lights, fan etc) to protect devices from surges in the system. Additionally, we could add isolators on the solar panels before the solar charge controller, to make working with the solar panels a bit safer, but this is not always required.
Please remember to take the proper safety precautions when working with electrics. See my disclaimer in Part 1.
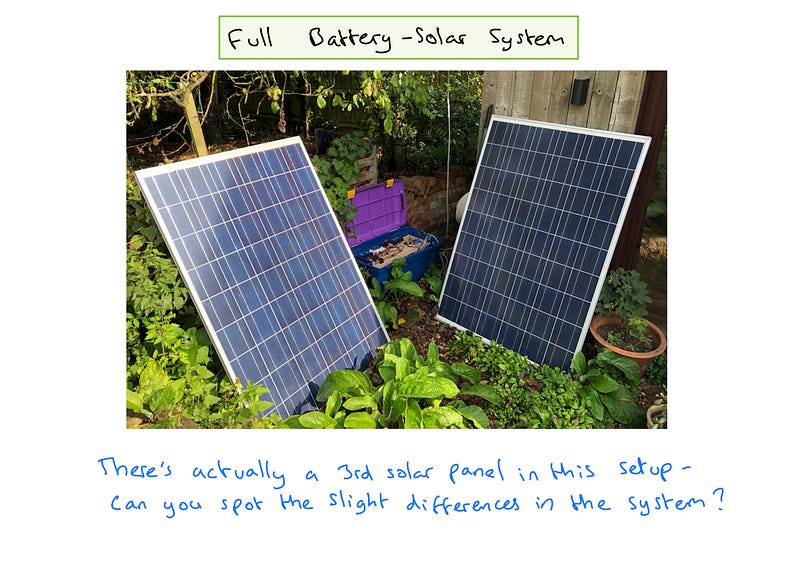
Here are some images of my example system to inspire your potential layout:
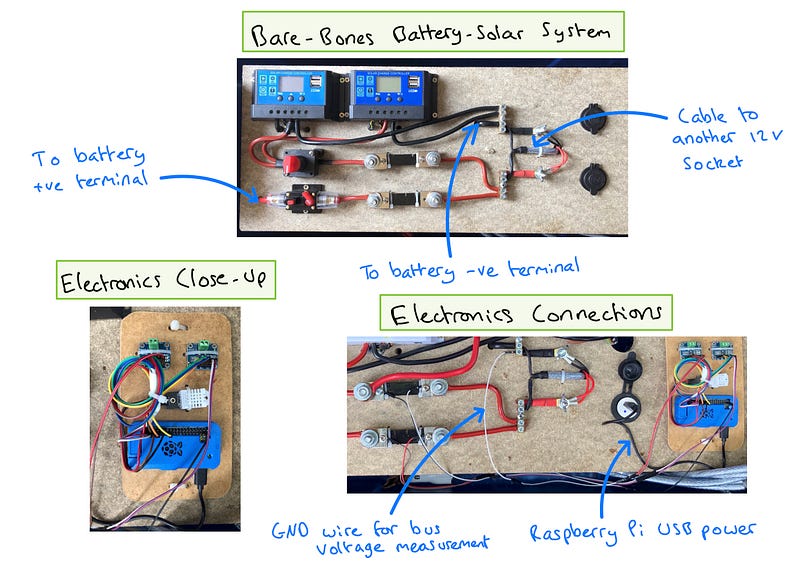
As you can see, I’ve mounted my system to a piece of wood and mounted the wood to the top of the box. This makes it convenient to reconfigure the system and route cables above or below the wood, with the battery hidden underneath.
It’s important to consider the shunt placement in your system. Try to keep it the same as in the schematic i.e. measuring the solar output and battery in/out, noting the polarity of the INA219 wires (which way round they’re wired up). Also, when wiring the INA219 modules up, consider how to wire them to the Raspberry Pi. For example, Vcc goes to 3V3 (as in the schematic). You can either connect them to different 3V3 pins, or the same one. The same goes for the GND pins since these are on their own respective ‘bus’ within the Raspberry Pi.
Conversely, since there is only one I2C circuit within the Raspberry Pi Zero, there is only one Sda and one Slc pin. Devices on the Sda and Slc pins need to be wired in parallel - Sda terminal to Sda terminal and Slc terminal to Slc terminal. Note the Sda and Slc wire termination points in the circuit diagram below the 0x40 INA219. Also, take note of the address of the INA219 modules. The 0x40 addressed INA219 measures the battery in/out, and the 0x44 addressed INA219 measures the solar output. See my article for information on how to address the INA219 modules.
The DHT22 sensor does not use I2C and the single data terminal can be routed to the GPCLK0 pin.
Now it’s up to you to build your system — please drop any questions you have in the comments!
Once the system is built, we can test it by charging and discharging the battery while observing the Voltmeter on the solar charge controllers (or by using a multimeter on the battery terminals), ensuring that the voltage stays within a ‘normal’ range of about 11.8V-14.4V dependant on battery state of charge and system status (charging or discharging).
Next Steps
When you’re happy with your basic battery-solar system electrics, we’re ready to move onto the next step. This will be setting up the Raspberry Pi with all the software goodness to start getting some juicy energy monitoring insights!
Well done for making it this far. I know there’s a lot to take in. If you’ve built a system, make sure to make the most of the energy you generate! Also drop a comment to tell us about it! If you’re just reading along for inspiration, I hope you’ve found the article useful. Maybe you can use these ideas in your future projects.
See you in the next part of the series where we’ll get stuck into the software!
Thank you for reading the whole article! It means a lot to me that you took some moments out of your day to consider my ideas :)
If you’re not a Medium member but have enjoyed reading along, please consider supporting me by subscribing to Medium via my referral link. If you do, I’ll receive a portion of your membership fees and it will enable me to write more articles similar to this one. Plus, you’ll gain access to all that the writers of Medium have to offer!
Have a great day!


