
Pandas DataFrame Advanced
A Complete Notebook Review #PurePythonSeries — Episode #04
INDEX
(1) Series
(2) DataFrame
(5) Missing Data
(6) Group By
(7) Cross Section
(8) Pivot Table
(9) Merging, Joining and Concatenation
1 — PANDAS Series — How to Create From…
import pandas as pdLet’s create four artifacts to see how to create a Series:
First, a List:
labels = ['a','b', 'c']Second, another List:
my_data = [10,20,30]Third, a Numpy array:
import numpy as nparr = np.array(my_data)And Finally, forth, a Dictionary:
dict = {'a':10, 'b':20, 'c':30}Create Series FROM LISTS
pd.Series(data=my_data, index=labels)a 10
b 20
c 30
dtype: int64Or, ordering, first data, then labels:
pd.Series(my_data, labels)a 10
b 20
c 30
dtype: int64Create Series FROM ARRAY
pd.Series(arr)0 10
1 20
2 30
dtype: int32Or, setting labels:
pd.Series(arr, labels)a 10
b 20
c 30
dtype: int32Create Series FROM DICTIONARY
This is the easiest and most intuitive way…
pd.Series(dict)a 10
b 20
c 30
dtype: int64Isn’t it?
2 — PANDAS DATAFRAME — Structure
import matplotlib.pyplot as plt%matplotlib inlineimport pandas as pddf = pd.DataFrame(data, index, columns)df = pd.DataFrame(d , i , c)Create a Pandas’ Dataframe by passing a dictionary:
# Ice Cream Sale - Last 12 Sunny Days
# visit this guide for more info: table style
d = {'X': [215,325,185,332,406,522,412,614,544,421,445,408], 'Y': [14.2,16.4,11.9,15.2,18.5,22.1,19.4,25.1,23.4,18.1,22.6,17.2]}df = pd.DataFrame(data=d)df.index = ['1°_dia','2°_dia', '3°_dia','4°_dia','5°_dia','6°_dia','7°_dia','8°_dia','9°_dia','10°_dia','11°_dia','12°_dia']df.columns = [ 'Ice_Cream_Sales', 'Temperature_°C']df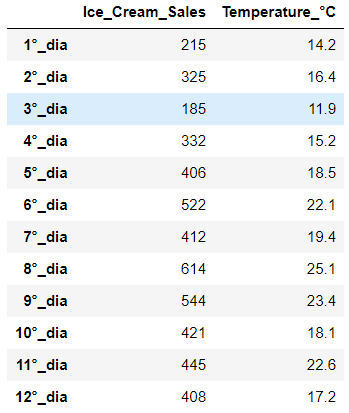
3 — Conditional Selection w/ DataFrame
Simple Conditional
df[df>20]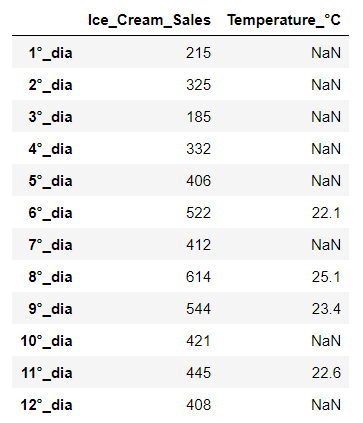
df[df['Temperature_°C']> 20]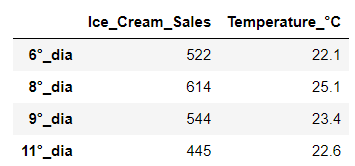
Return a subset of DataFrame
There are 2 general formats for GRABBING ELEMENTS from a DataFrame:DOUBLE BRACKET FORMAT
df[line][column]SINGLE BRACKET FORMAT
df[line,column](w/ comma, this is least prone to error!)Multiple Lines Solution
boolser = df['Temperature_°C']>23
result = df[boolser]
mycols = ['Temperature_°C', 'Ice_Cream_Sales']
result[mycols]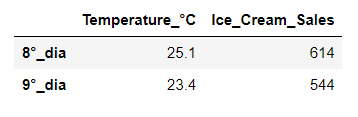
Single Line (All-in-One)
One_line Conditional Solution:
# Slicing w/ Double Bracket Format# df[][]# df[inequality][[pass_a_list_of_columns]]# df[df[]>0][['','']]df[df['Temperature_°C']>23][['Temperature_°C', 'Ice_Cream_Sales']]Multiple Conditional Solution:
Python Use AND OR In Multiple Single Conditional
True and TrueTrueAgain:
True and FalseFalseOnce more:
True or TrueTrueOr:
True or FalseTrueBut here, this Operation will return an ERROR :/
df[(df['Temperature_°C']>23) and (df['Temperature_°C']<26)]Instead, use AMPERSAND (&) or PIPE( | ) as below:
df[(df['Temperature_°C']>23) & (df['Temperature_°C']<26)]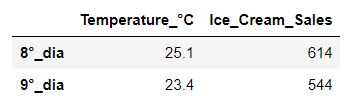
df[(df['Temperature_°C']<14) | (df['Temperature_°C']>22)]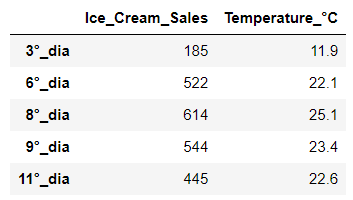
4 — SET AND RESET INDEX
Transform the old index into a column:
resetted_df = df.reset_index()resetted_df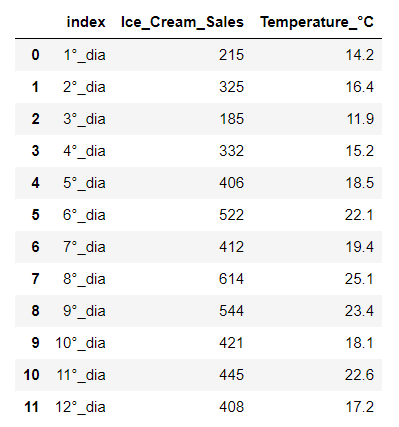
Return index column as real index:
resetted_df.set_index('index')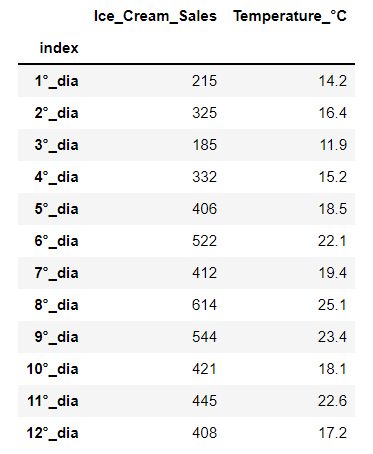
5 — MISSING DATA
Creating DataFrame From Dictionary:
dict = {'A':[1,2,np.nan],'B':[5, np.nan, np.nan],'C':[1,2,3]}Creating a DataFrame from dictionary:
df = pd.DataFrame(dict)
df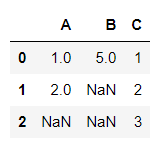
Note that the First Line (Zero) and the Last Column (C) are Complete!
axis=0 is the default; Returning the First Line ( Zero ):
df.dropna()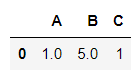
Returning the Last Column ( C ):
df.dropna(axis=1)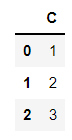
Returning if the Column has at least 2 elements:
df.dropna(axis=1, thresh=2)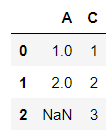
Filling the blank values:
df.fillna(value ='FILL_VALUE')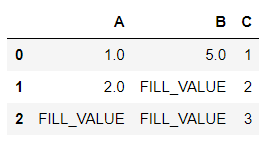
Filling the blank cells with the MEAN OF COLUMN ‘A’:
df.fillna(value=df['A'].mean())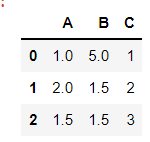
Letting Pandas sort out how best to fill the table (ffill — fluid fill:)
df.ffill()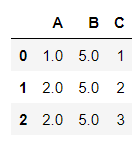
6 — GROUP BY
company = ['GOOG', 'GOOG', 'MSTF', 'MSTF', 'FB', 'FB']More list:
person = ['Sam', 'Charlie', 'Amy', 'Vanessa', 'Carl', 'Sarah']Once more list:
sales = [200,120,340,124,245,350]Save an empty DataFrame:
df = pd.DataFrame()Join it all in the newly created DataFrame:
df['company'] = company
df['person'] = person
df['sales'] = sales
df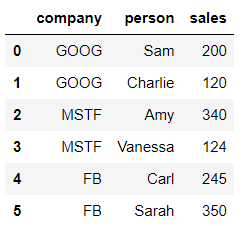
Run groupby():
bycompany = df.groupby('company')Here is the aggregate functions:
bycompany.sum()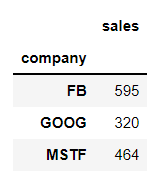
bycompany.std()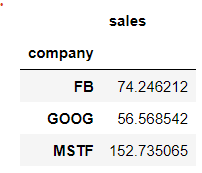
bycompany.count()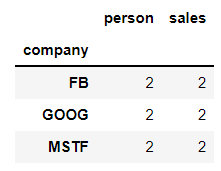
bycompany.max()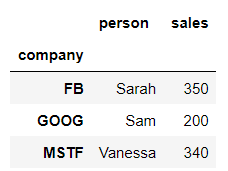
bycompany.min()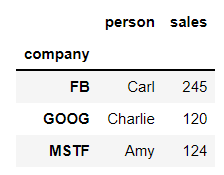
bycompany.describe()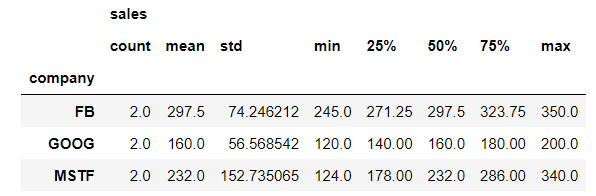
bycompany.describe().transpose()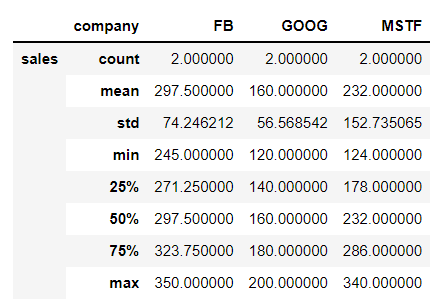
7 — Multilevel DataFrame — CROSS SECTION
Let’s create a multilevel DataFrame:
outside = ['G1', 'G1', 'G1', 'G2', 'G2', 'G2']
inside = [1,2,3,1,2,3]
hier_index = list(zip(outside, inside))
hier_index = pd.MultiIndex.from_tuples(hier_index)Create a Multilevel DataFrame:
df = pd.DataFrame(np.random.randn(6,2), hier_index, ['A', 'B'])df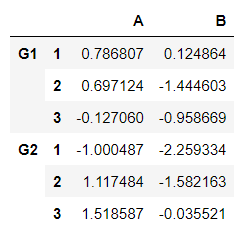
Separating Group 1:
df.loc['G1']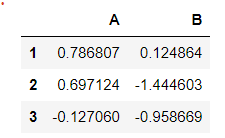
Or Group 2:
df.loc['G2']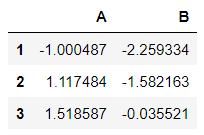
In Group 2, return row one:
df.loc['G2'].loc[1]A -1.000487
B -2.259334
Name: 1, dtype: float64Or specific value:
df.loc['G2'].loc[1][0]-1.0004870600502171Now the Index names:
df.index.namesIt’s blank…
FrozenList([None, None])This is just a Pandas index names object types. All it’s saying here is that these indices don’t have any names but you can go ahead and do say equals and then pass in a list of names.
Let’s name each index:
df.index.names = ['Groups', 'Num']df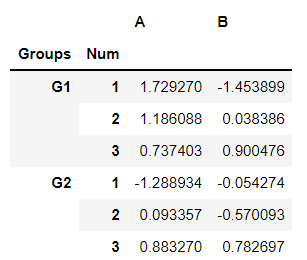
Cross Section (xs):
df.xs(1, level='Num')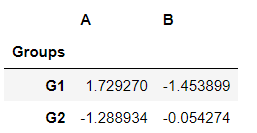
df.xs(3, level='Num')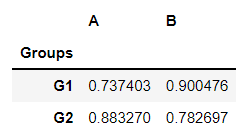
8 — PIVOT TABLE
A = ["G2", "G2", "G2", "G2", "G2", "G1", "G1", "G1", "G1"]
B = [1, 1, 1, 2, 2, 1, 1, 2, 2]
C = [2, 1, 1, 2, 2, 1, 2, 2, 1]
D = [1, 2, 2, 1, 2, 1, 2, 1, 1]
E = [2, 1, 2, 2, 1, 1, 2, 2, 1]
Create an empty DataFrame:
df = pd.DataFrame()Populating it:
df['A'] = A
df['B'] = B
df['C'] = C
df['D'] = D
df['E'] = E
df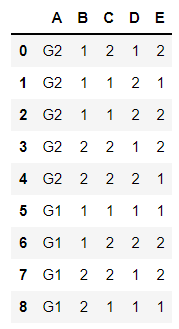
Here is the pivot table:
df.pivot_table(values='D', index=['A', 'B'], columns=['C'], fill_value=0 )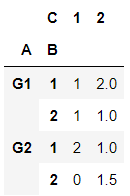
This example aggregates values by taking the sum:
table = pd.pivot_table(df, values='D', index=['A', 'B'],columns=['C'], aggfunc=np.sum, fill_value=0Calling the table object:
table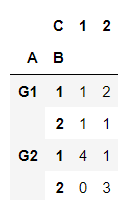
9 — MERGING, JOINING, and CONCATENATION
2 DataFrames: left and right:
left = pd.DataFrame({'key':['K0','K1','K2','K3'], 'A':['A0','A1','A2','A3'], 'B':['B0','B1','B2','B3'], })left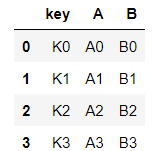
right = pd.DataFrame({'key':['K0','K1','K2','K3'], 'A':['A4','A5','A6','A7'], 'B':['B4','B5','B6','B7'], })right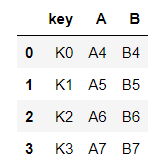
Merging
pd.merge(left,right,how='inner',on='key')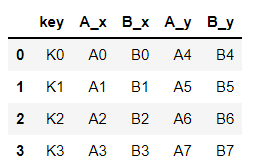
Joining
left.join(right, how='inner', lsuffix='_left', rsuffix='_right')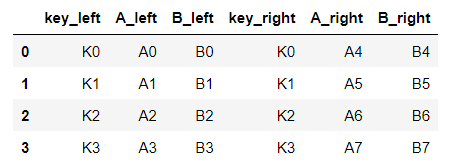
Concatenation
pd.concat([left, right])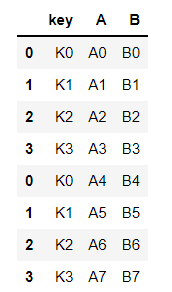
pd.concat([left, right], axis=1)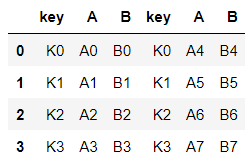
print("I hope you enjoyed that lecture o/\nIf you find this post helpful, please click the applause button and subscribe to the page for more articles like this one.\nHave a Nice Day!")I hope you enjoyed that lecture o/ If you find this post helpful, please click the applause button and subscribe to the page for more articles like this one. Have a Nice Day!

Until next time!
👉Jupiter notebook link :)
👉or collab link
👉git
Credits & References
Jose Portilla — Python for Data Science and Machine Learning Bootcamp — Learn how to use NumPy, Pandas, Seaborn, Matplotlib, Plotly, Scikit-Learn, Machine Learning, Tensorflow, and more!
Related Posts
00#Episode#PurePythonSeries — Lambda in Python — Python Lambda Desmistification
01#Episode#PurePythonSeries — Send Email in Python — Using Jupyter Notebook — How To Send Gmail In Python
02#Episode#PurePythonSeries — Automate Your Email With Python & Outlook — How To Create An Email Trigger System in Python
03#Episode#PurePythonSeries — Manipulating Files With Python — Manage Your Lovely Photos With Python!
04#Episode#PurePythonSeries — Pandas DataFrame Advanced — A Complete Notebook Review (this one)
05#Episode#PurePythonSeries — Is This Leap Year? Python Calendar — How To Calculate If The Year Is Leap Year and How Many Days Are In The Month
06#Episode#PurePythonSeries — List Comprehension In Python — Locked-in Secrets About List Comprehension
07#Episode#PurePythonSeries — Graphs — In Python — Extremely Simple Algorithms in Python
08#Episode#PurePythonSeries — Decorator in Python — How To Simplifying Your Code And Boost Your Function


