Pandas-Bokeh to Make Stunning Interactive Plots Easy!

Upgrade Your Dull Pandas Plots to Stunning Interactive Plots
I hate the boring and dull graphs by Pandas’ basic plotting functions. The graphs make your data science work so unprofessional. Your audience may doubt you do not know how to use Excel, or why you do not even make the effort to dump the data in Microsoft Excel for a better image. If this is your struggle, here I want to highlight Pandas-Bokeh. It will turn your Pandas plots “Bokeh-stunningly interactive”.
What is Bokeh?
It is interesting to start with some fun facts: The word Bokeh comes from photography in Japanese. It means the aesthetic quality of the blur produced in the out-of-focus parts of an image produced by a lens.
Here is Bokeh’s official introduction: “Bokeh is an interactive visualization library for modern web browsers. It provides elegant, concise construction of versatile graphics, and affords high-performance interactivity over large or streaming datasets. Bokeh can help anyone who would like to quickly and easily make interactive plots, dashboards, and data applications.”
More on the Data Visualization Series
I have written a series of articles on data visualization, including “Pandas-Bokeh to Make Stunning Interactive Plots Easy”, “Use Seaborn to Do Beautiful Plots Easy”, “Powerful Plots with Plotly” and “Create Beautiful Geomaps with Plotly”. I have written articles on a variety of data science topics. For the ease of use, you can bookmark my summary post “Dataman Learning Paths — Build Your Skills, Drive Your Career” that list the links to all articles. My goal In the data visualization articles is to assist you to produce data visualization exhibits and insights proficiently and easily. If you are researching data visualization now, please take a look of the articles.
Pandas-Bokeh is Like a Mini Version of Bokeh
In this post I will compare and contrast what the plain Pandas plotting does and the Pandas-Bokeh does for the following plots:
- Line Plots
- Scatter Plots
- Histograms
- Pie Charts
- Area Plots
Pandas-Bokeh does not support other rich types of plots such as box plots, plots with siders, Violin plots, etc. For those plots, you are advised to check the examples in the Bokeh gallery.
Almost No Need to Change Your Pandas Plotting Syntax
Pandas-Bokeh work with Pandas’ plotting syntax in most of the cases, so you do not need to learn new syntax. This is a big advantage of using Pandas-Bokeh. As Pandas-Bokeh explains, it provides native support as a Pandas Plotting backend for Pandas≥0.25. I say “in most of the cases” because in some minor incidents you need to write your code slightly differently (as I will show you in the article). To start, you just add two more lines import pandas_bokeh and pd.set_option() as below:
(A) Line Plots
When you use pandas-bokeh, make sure you use import pandas_bokeh at the beginning of the code.
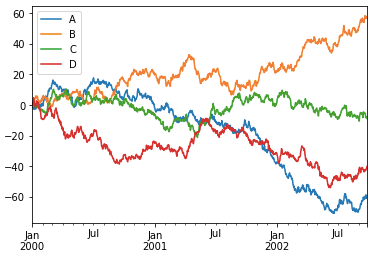
The above code opens a new window for the interactive HTML below. You can save the output as an HTML file then insert in your PowerPoint Presentation or use it as a stone alone exhibit. The values are shown as my cursor moves along the lines. The utility icons to the right enable you to zoom in, zoom out, save, or reset. You can also turn each line on or off. (Note: Some phones may not be able to show the interactive plots. Please use a laptop if that’s the case.)
(B) Scatter Plots
When you use pandas-bokeh, make sure you use import pandas_bokeh at the beginning of the code.
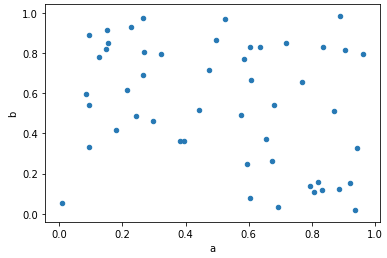
The values of each observation are shown as my cursor moves. You can also hide or show the observations.
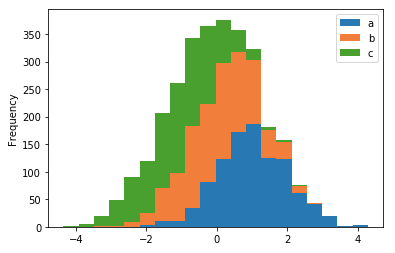
(C) Histograms
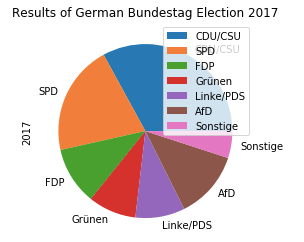
(D) Pie Charts
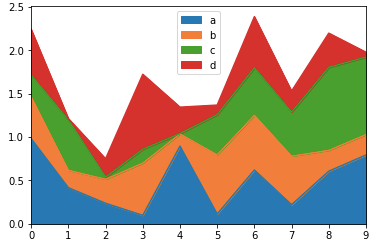
(E) Area Plots