Why Is Measuring Inflation So Damn Hard?
Math has less to do with CPI than you might think.
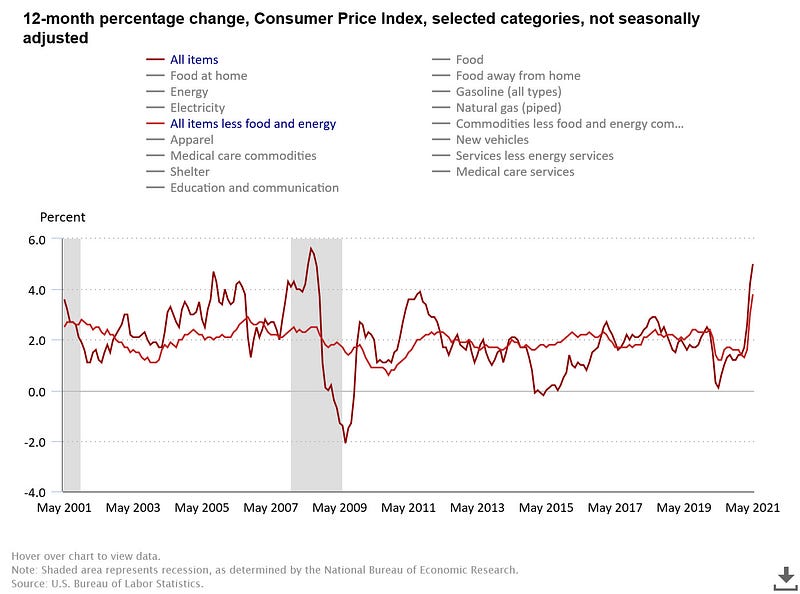
The inflation alarmists came out in force this month, and for good reason. The May CPI reading showed an annual price increase of 5%.
That’s a scary number for many reasons, not the least of which is that we are still down millions of jobs compared to pre-pandemic times. Imagine how much money will be spent (and high prices will go) when those millions of people have full incomes and not just limping along with unemployment benefits.
But how exactly is inflation measured and is it accurate? The initial calculation was simple but has evolved into a complex algorithm.
Let’s take a look at how CPI came to be, how it’s calculated today, and address some of its downfalls.
(Note: For those with math-phobia, don’t worry. I won’t into the nitty-gritty with Greek symbols and calculus. We’ll focus more on the decisions behind the math used, which is the true source of today’s CPI.)
The Original Calculation
The Bureau of Labor Statistics (BLS) started tracking consumer prices in the late 1800’s. The inflation caused by World War I required an accurate accounting of consumer prices, and the first CPI report was released in 1919.
Regular periodic releases started in 1921, with estimates as far back as 1913, and reports have been published ever since.
The initial “basket of goods” was representative of what an average family could be expected to buy over the course of a year, split into six major categories: food, clothing, rent, fuels, house furnishings, and miscellaneous.
This baseline was meant to establish a standard basic of living, the price of which could then be compared to previous years. The increase/decrease in price of the same goods would then establish the inflation/deflation number.
To account for geographic disparities, the BLS collected prices from 92 different locations and published reports for 32 different cities.
Keep in mind that the original statistic is considered a cost of goods index that reflected a set standard of living. This is important to remember, as today’s CPI does not reflect this goal.
Today’s Algorithm
The description of CPI above sounds like a good idea, but changes need to be accommodated for, beyond merely location.
Technology
This is a pithy example, but iPhones did not exist in 1921. Hell, in 1919, ATT was still measuring people’s heads to decide on the optimum size and spacing of the handset for the first telephone not to be attached to a wall.
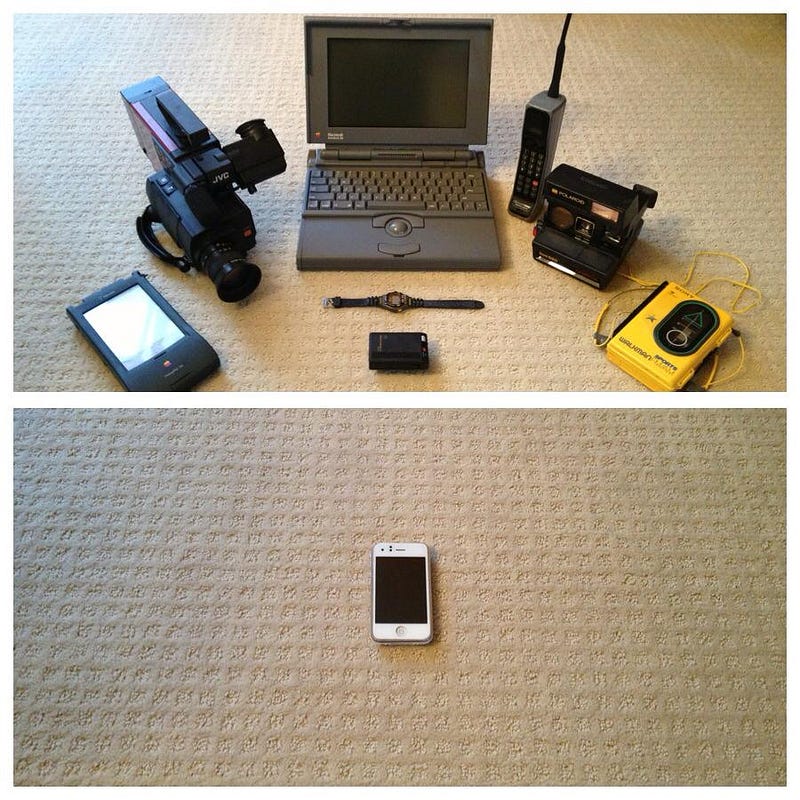
Moreover, the iPhone didn’t just replace old mobile phones. It also replaced watches, video cameras, computers (both nascent laptops and desktops), a Walkman, a camera, a pager, and a PDA.
So how does the CPI account for that?
The short answer is that is drops the old stuff out and adds the new stuff in.
The longer answer is that there was a substitution in the overall calculation, with the technologically new products being weighted about the same as the old out-of-date products.
For you math nerds, here’s a screenshot from the BLS CPI Handbook of Methods.
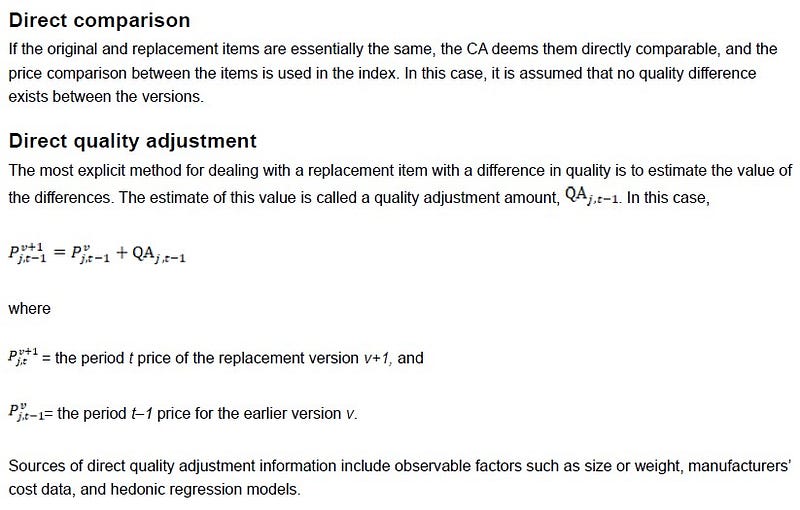
The math is all well and good, but the core to the math is the value assigned to both the old and new technologies.
For example, how many people took videos prior to the iPhone. Not that many.
Even with the decreasing size and increasing video capability of standalone digital cameras, video was still relatively rare. Nowadays, people create TikToks in their car while at a red light.
What mathematical value do you put on that?
How do you measure and quantify the societal shift to and adoption of new technologies, and then compare it to the old.
Before the math comes psychology of the masses.
Substitution
This is probably the most contentious subject, which has PhD economists practically screaming at each other about the best way to include product substitution when prices change.
I touched on this in a previous article about inflation when talking about the website ShadowStats and their take on
[John Williams of Shadowstats] claims that the use of substitutions (e.g. buying ground beef when steak is priced too high) is over weighted.
The overuse of substitutions results in two linked, but distinct, effects:
- The impact of price increases is muted, as we can buy cheaper stuff while spending the same amount, meaning no “official” inflation.
- The “standard quality of life” is reduced, since those cheaper items are of lower quality, hence their lower price. (emphasis added)
In short, our quality of life is deflated when we can’t afford financial inflation.
The second effect is the heart of the substitution argument.
When the original CPI was created, it was meant to show how cost was increasing or decreasing for a standard quality of life. If you ate steak in 1919, how much more or less did it cost you to eat steak in 1920?
The introduction of substitutions due to price changes changed the CPI to a standard cost of living. Sure, you can buy cheaper hamburger meat or chicken thighs when steak prices get too high; that’s just economics. But are you really maintaining the same qualify of life? Meat preferences aside, probably not.
Data Collection
Want me to really blow your mind?
In 2021, after the COVID pandemic that moved almost everything online, the majority of raw price gathering is still performed by BLS employees walking into physical stores.
The CPI survey collects about 94,000 prices per month to compute indexes for commodities and services.
Approximately two-thirds of price collection in the CPI is done by personal visits of CPI data collectors to brick-and-mortar stores.
The remaining data are collected by telephone or on the outlet’s website.
There are a couple of big problem with the manual, in-person data collection.
- First, it takes too much time.
Inflation reports are published on a set schedule. If the collectors are behind on getting their data collected, then the report comes out with incomplete data, subject to much larger future revisions.
- Second, CPI is a lagging indicator.
The June report was for May, but the beginning of May was six weeks ago. The world turns fast even in “stable” times. The actual current inflation in mid-June might be 7% or 8%. We won’t know until early July.
BLS is looking harness the real-time, big data that retail stores have at their fingertips, but government agencies move at a glacial pace. I expect to see the same manual data collection for the next decade.
The Takeaway
When reading about economic numbers, government or private sector, you need to take the information with a grain of salt.
The news (and yes, even Medium writers, myself included) have a tendency to take official numbers as the gospel truth.
The reality is that establishing metrics for a country as large as the United States takes time, effort, and a lot of statistical modeling. Those models are based on assumptions of a future that may not come to pass.
Treat these numbers as guidelines rather than hard and fast rules, and beware any author, or government agency, that does not respect their complexity or fallibility.
Most Recent Stories
- This is What Happens When You Irrigate a Desert.
- Parents: How to Add a COVID Career Gap on Your Resume.
- The K-Shaped Student Loan Story
- Breaking Down the Jobs Report — May 2021
- PSLF Will Only Get Better
Don’t miss my next article! Click here to get notified when I publish new material.
If you love the articles published in Money. Daily., then become a member of the Medium community and get full access to our full archives.
This article is for informational purposes only, it should not be considered Financial or Legal Advice. Not all information will be accurate. Consult a financial professional before making any major financial decisions.