
Master-Level Questions in Pandas
The following questions deal with the flight delays and cancellations data set from Kaggle: https://www.kaggle.com/datasets/usdot/flight-delays
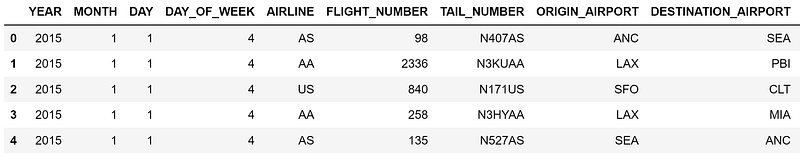
The file flights.csv contains 5.8 million rows with data on flights that took place in the US in the year 2015. It has 31 columns with detailed information on each flight, such as the date of the flight, the airline identifier, origin and destination airports, and whether the flight was cancelled or diverted.
Here are the first five rows from this data set (showing only the first 9 columns):
Download the flights.csv file and use Pandas to answer the following questions. The questions are organized from easy to hard.
- Find how many flights departed from LAX airport in July 2015.
- Find the number of the flight that had the longest arrival delay.
- Find the airport with the highest number of arriving flights.
- Find the day of week that had the highest number of flight cancellations.
- Create a bar plot showing the number of flights for each airline.
- Find the mean arrival delay for each airline.
- Find the airlines that had more than 10,000 cancellations.
- Find airlines having more than 2% of their flights cancelled. For each such airline, print its identifier and the percentage of cancelled flights.
- Find the three top airlines with the highest number of cancelled or diverted flights.
- Find the longest sequence of on-time flights for each airline (an on-time flight is a flight with less than 15 minutes arrival delay).
The solutions can be found in this post.
Don’t forget to check out my previous master-level questions: