avatarDr. Roi Yehoshua

Free AI web copilot to create summaries, insights and extended knowledge, download it at here

5605

Abstract

e value is the number of flights.</li><li>Call the <a href="https://pandas.pydata.org/docs/reference/api/pandas.Series.plot.bar.html">plot.bar</a>() method on the Series object returned from the previous step.</li></ul><p id="04f9">The final solution is:</p><div id="40d8"><pre>flights.groupby(<span class="hljs-string">'AIRLINE'</span>).size().plot.bar()</pre></div><p id="d67a">And the bar plot we get is:</p><figure id="c59d"><img src="https://cdn-images-1.readmedium.com/v2/resize:fit:800/1*HcNrdEoVdHqWA1Gy4uE4uA.png"><figcaption></figcaption></figure><p id="af60">6. Find the mean arrival delay for each airline.</p><p id="c353">Here we can simply group the flights by airline, and then compute the mean of the ARRIVAL_DELAY column for each group:</p><div id="bb24"><pre>flights.groupby(<span class="hljs-string">'AIRLINE'</span>)[<span class="hljs-string">'ARRIVAL_DELAY'</span>].mean()</pre></div><p id="e8f7">The output is:</p><div id="c314"><pre><span class="hljs-attribute">AIRLINE</span> <span class="hljs-attribute">AA</span> <span class="hljs-number">3</span>.<span class="hljs-number">451372</span> <span class="hljs-attribute">AS</span> -<span class="hljs-number">0</span>.<span class="hljs-number">976563</span> <span class="hljs-attribute">B6</span> <span class="hljs-number">6</span>.<span class="hljs-number">677861</span> <span class="hljs-attribute">DL</span> <span class="hljs-number">0</span>.<span class="hljs-number">186754</span> <span class="hljs-attribute">EV</span> <span class="hljs-number">6</span>.<span class="hljs-number">585379</span> <span class="hljs-attribute">F9</span> <span class="hljs-number">12</span>.<span class="hljs-number">504706</span> <span class="hljs-attribute">HA</span> <span class="hljs-number">2</span>.<span class="hljs-number">023093</span> <span class="hljs-attribute">MQ</span> <span class="hljs-number">6</span>.<span class="hljs-number">457873</span> <span class="hljs-attribute">NK</span> <span class="hljs-number">14</span>.<span class="hljs-number">471800</span> <span class="hljs-attribute">OO</span> <span class="hljs-number">5</span>.<span class="hljs-number">845652</span> <span class="hljs-attribute">UA</span> <span class="hljs-number">5</span>.<span class="hljs-number">431594</span> <span class="hljs-attribute">US</span> <span class="hljs-number">3</span>.<span class="hljs-number">706209</span> <span class="hljs-attribute">VX</span> <span class="hljs-number">4</span>.<span class="hljs-number">737706</span> <span class="hljs-attribute">WN</span> <span class="hljs-number">4</span>.<span class="hljs-number">374964</span> <span class="hljs-attribute">Name</span>: ARRIVAL_DELAY, dtype: float64</pre></div><p id="ae83">7. Find the airlines that had more than 10,000 cancellations.</p><p id="a1c1">The solution consists of the following steps:</p><ul><li>Find all the flights that were cancelled by using Boolean indexing: flights[flights[‘CANCELLED’] == 1]</li><li>Group all the cancelled flights by airline and find the size of each group.</li><li>Filter only those groups whose size is larger than 10,000, by using Boolean indexing on the Series object returned from the previous step.</li></ul><p id="ef4d">The final solution is:</p><div id="89b2"><pre>df = flights[flights[<span class="hljs-string">'CANCELLED'</span>] == <span class="hljs-number">1</span>].groupby(<span class="hljs-string">'AIRLINE'</span>).size() df[df > <span class="hljs-number">10000</span>]</pre></div><p id="df17">And the output is:</p><div id="ac5d"><pre><span class="hljs-attribute">AIRLINE</span> <span class="hljs-attribute">AA</span> <span class="hljs-number">10919</span> <span class="hljs-attribute">EV</span> <span class="hljs-number">15231</span> <span class="hljs-attribute">MQ</span> <span class="hljs-number">15025</span> <span class="hljs-attribute">WN</span> <span class="hljs-number">16043</span> <span class="hljs-attribute">dtype</span>: int64</pre></div><p id="96c4">8. Find airlines having more than 2% of their flights cancelled. For each such airline, print its identifier and the percentage of cancelled flights.</p><p id="122a">The solution consists of the following steps:</p><ul><li>Group the flights by airline.</li><li>Find the percentage of cancelled flights in each airline by calling the <a href="https://pandas.pydata.org/docs/reference/api/pandas.core.groupby.DataFrameGroupBy.mean.html">mean</a>() method on the CANCELLED column of each group. Since this column contains only the numbers 0 and 1, the mean() method will return how many flights were cancelled by each airline divided by the total number of flights of that airline, which is exactly the percentage of cancelled flights.</li><li>Filter only the airlines that had a percentage of cancellations higher than 2%, by using Boolean indexing on the Series object returned from the previous step.</li></ul><p id="8d4b">The final solution is:</p><div id="a5d9"><pre>df = flights.groupby(<span class="hljs-string">'AIRLINE'</span>)[<span class="hljs-string">'CANCELLED'</span>].mean() df[df > <span class="hljs-number">0.02</span>]</pre></div><p id="4b1d">And the output is:</p><div id="137d"><pre><span class="hljs-attribute">AIRLINE</span> <span class="hljs-attribute">EV</span> <span class="hljs-number">0</span>.<span class="hljs-number">026629</span> <span class="hljs-attribute">MQ</span> <span class="hljs-number">0</span>.<span class="hljs-number">050996</span> <span class="hljs-attribute">US</span> <span class="hljs-number">0</span>.<span class="hljs-number">020466</span>

Options

<span class="hljs-attribute">Name</span>: CANCELLED, dtype: float64</pre></div><p id="9820">9. Find the three top airlines with the highest number of cancelled or diverted flights.</p><p id="857f">The solution here consists of the following steps:</p><ul><li>Find all the flights that were either cancelled or diverted by using Boolean indexing: flights[(flights[‘CANCELLED’] == 1) | (flights[‘DIVERTED’] == 1)]</li><li>Count the number of flights each airline has in the DataFrame returned from the previous step, by applying the method <a href="https://pandas.pydata.org/docs/reference/api/pandas.Series.value_counts.html">value_counts</a>() on the AIRLINE column. This method will return a Series object with the number of cancelled or diverted flights for each airline. The Series will be in descending order so that the first element would be the airline with the highest number of cancelled or diverted flights.</li><li>Return the three top airlines with the highest counts by using slicing [:3] on the Series object returned from the previous step.</li></ul><p id="af31">The final solution is:</p><div id="dc41"><pre>flights[(flights[<span class="hljs-string">'CANCELLED'</span>] == <span class="hljs-number">1</span>) | (flights[<span class="hljs-string">'DIVERTED'</span>] == <span class="hljs-number">1</span>)][<span class="hljs-string">'AIRLINE'</span>].value_counts()[:<span class="hljs-number">3</span>]</pre></div><p id="6eaa">And the output is:</p><div id="a63a"><pre><span class="hljs-attribute">WN</span> <span class="hljs-number">19452</span> <span class="hljs-attribute">EV</span> <span class="hljs-number">17225</span> <span class="hljs-attribute">MQ</span> <span class="hljs-number">15841</span> <span class="hljs-attribute">Name</span>: AIRLINE, dtype: int64</pre></div><p id="c5f6">10. Find the longest sequence of on-time flights for each airline (an on-time flight is a flight with less than 15 minutes arrival delay).</p><p id="7e9d">The solution consists of the following steps:</p><ul><li>Group the flights by airline.</li><li>Aggregate the ARRIVAL_DELAY column of each group using the <a href="https://pandas.pydata.org/pandas-docs/version/0.22/generated/pandas.core.groupby.DataFrameGroupBy.agg.html">agg</a>() method with a custom function.</li></ul><p id="48b3">The custom aggregate function will do the following:</p><ul><li>Find all the flights in the group with a delay of 15 minutes or more. This will return a Boolean array with True or False for each flight.</li><li>Use the <a href="https://pandas.pydata.org/docs/reference/api/pandas.DataFrame.cumsum.html">cumsum</a>() method to compute the cumulative sum of the Boolean values returned from the previous step. For example, if the array returned from the previous step is [False, True, True, False, False, True], then cumsum() will return [0, 1, 2, 2, 2, 3] (since False is treated as 0 and True as 1). Notice that when there is a sequence of flights with a delay of less than 15 minutes, the number in the cumulative sum array remains the same (since we have a sequence of False values).</li><li>Use value_counts() to find how many times each number appears in the cumulative sum array. These counts represent the lengths of the sequences of on-time flights.</li><li>Take the maximum of the value counts to get the longest sequence of on-time flight and subtract from it 1 (since cumsum() added an extra 1 for each sequence).</li></ul><p id="b750">The final solution is:</p><div id="d87e"><pre>flights.groupby(<span class="hljs-string">'AIRLINE'</span>)[<span class="hljs-string">'ARRIVAL_DELAY'</span>].agg( <span class="hljs-keyword">lambda</span> delay: (delay >= <span class="hljs-number">15</span>).cumsum().value_counts().<span class="hljs-built_in">max</span>() - <span class="hljs-number">1</span>)</pre></div><p id="2594">And the output is:</p><div id="3e7d"><pre><span class="hljs-attribute">AIRLINE</span> <span class="hljs-attribute">AA</span> <span class="hljs-number">156</span> <span class="hljs-attribute">AS</span> <span class="hljs-number">110</span> <span class="hljs-attribute">B6</span> <span class="hljs-number">170</span> <span class="hljs-attribute">DL</span> <span class="hljs-number">207</span> <span class="hljs-attribute">EV</span> <span class="hljs-number">128</span> <span class="hljs-attribute">F9</span> <span class="hljs-number">163</span> <span class="hljs-attribute">HA</span> <span class="hljs-number">213</span> <span class="hljs-attribute">MQ</span> <span class="hljs-number">117</span> <span class="hljs-attribute">NK</span> <span class="hljs-number">63</span> <span class="hljs-attribute">OO</span> <span class="hljs-number">121</span> <span class="hljs-attribute">UA</span> <span class="hljs-number">161</span> <span class="hljs-attribute">US</span> <span class="hljs-number">103</span> <span class="hljs-attribute">VX</span> <span class="hljs-number">116</span> <span class="hljs-attribute">WN</span> <span class="hljs-number">302</span> <span class="hljs-attribute">Name</span>: ARRIVAL_DELAY, dtype: int64</pre></div><p id="0037">To understand the solution better, I suggest that you run each one of the steps above individually, and examine the results that you get after each step.</p><h2 id="eca4">Final Notes</h2><p id="c755">You can find the Jupyter notebook with all the solutions on my github: <a href="https://github.com/roiyeho/medium/tree/main/master_questions/pandas">https://github.com/roiyeho/medium/tree/main/master_questions/pandas</a></p><p id="97ab">Thanks for reading!</p></article></body>

Solutions to Master-Level Questions in Pandas

This article provides solutions to the Pandas master-level exercises that were published in this post.

First, we need to download the flights data set from Kaggle and load it into our Jupyter notebook:

import pandas as pd

flights = pd.read_csv('data/flights.csv')
flights.head()
The flight delays and cancellations data set

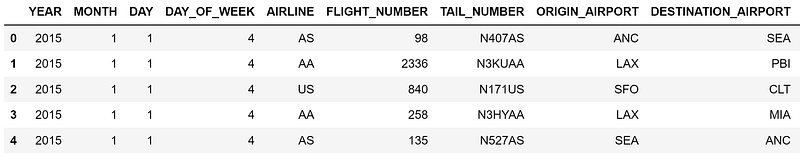
We are now ready to answer the questions.

  1. Find how many flights departed from LAX airport in July 2015.

To solve this question, we need to use Boolean indexing in order to filter the flights. Our Boolean condition consists of three parts that check the values in the columns ‘ORIGIN_AIRPORT’, ‘YEAR’ and ‘MONTH’. These parts are combined with the & (and) operator:

flights[(flights['ORIGIN_AIRPORT'] == 'LAX') & (flights['YEAR'] == 2015) & (flights['MONTH'] == 7)

Note that the different parts must be grouped using parentheses, since in Python the bitwise operators (&, |, ~) have a higher precedence over the comparison operators (such as < and >).

Since we are only interested in how many flights satisfy the condition and not in the flights themselves, we can use the len() function to count how many rows returned from the query:

len(flights[(flights['ORIGIN_AIRPORT'] == 'LAX') & (flights['YEAR'] == 2015) & (flights['MONTH'] == 7)])

And the output is:

19371

2. Find the number of the flight that had the longest arrival delay.

The solution consists of two steps:

  • First we find the index of the flight that had the longest arrival delay by using the DataFrame’s idxmax() method.
  • Once we locate the row of this flight, we can use the loc() method to get the value of the column FLIGHT_NUMBER in that row.

The final solution is:

flights.loc[flights['ARRIVAL_DELAY'].idxmax(), 'FLIGHT_NUMBER']

And the output is:

1322

3. Find the airport with the highest number of arriving flights.

The solution consists of the following steps:

  • Group the flights by the DESTINATION_AIRPORT column.
  • Count the number of flights in each group using the size() method. This method will return a Series object, whose index is the name of the airport and its value is the number of arriving flights.
  • Find the airport with the highest number of arriving flights by calling idxmax() on the Series that we got from the previous step.

The final solution is:

flights.groupby('DESTINATION_AIRPORT').size().idxmax()

And the output is:

'ATL'

4. Find the day of week that had the highest number of flight cancellations.

The solution consists of the following steps:

  • Group the flights by the DAY_OF_WEEK column.
  • Get the number of cancelled flights for each day of week, by applying the sum() method on the CANCELLED column of each group.
  • Use idxmax() on the Series returned from the previous step to get the day of week with the highest number of cancellations.

The final solution is:

flights.groupby('DAY_OF_WEEK')['CANCELLED'].sum().idxmax()

And the output is:

1

That is, Sunday is the day with the highest number with cancellations.

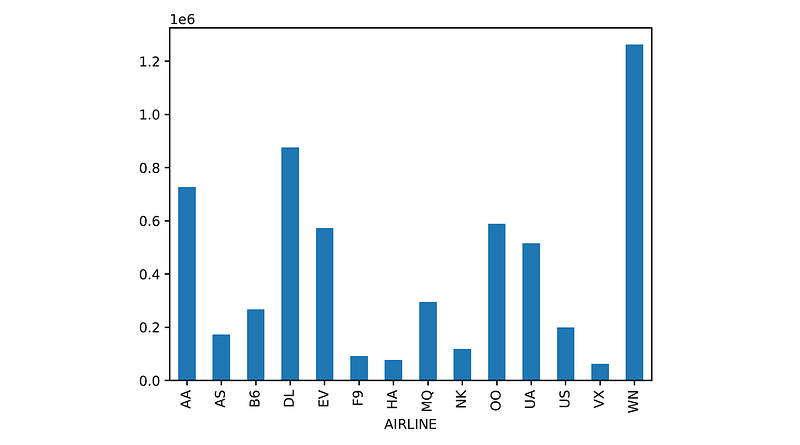
5. Create a bar plot showing the number of flights for each airline.

The solution consists of the following steps:

  • Group the flights by the AIRLINE column.
  • Count the number of flights for each airline using the size() method. This will return a Series object, whose index is the airline name and the value is the number of flights.
  • Call the plot.bar() method on the Series object returned from the previous step.

The final solution is:

flights.groupby('AIRLINE').size().plot.bar()

And the bar plot we get is:

6. Find the mean arrival delay for each airline.

Here we can simply group the flights by airline, and then compute the mean of the ARRIVAL_DELAY column for each group:

flights.groupby('AIRLINE')['ARRIVAL_DELAY'].mean()

The output is:

AIRLINE
AA     3.451372
AS    -0.976563
B6     6.677861
DL     0.186754
EV     6.585379
F9    12.504706
HA     2.023093
MQ     6.457873
NK    14.471800
OO     5.845652
UA     5.431594
US     3.706209
VX     4.737706
WN     4.374964
Name: ARRIVAL_DELAY, dtype: float64

7. Find the airlines that had more than 10,000 cancellations.

The solution consists of the following steps:

  • Find all the flights that were cancelled by using Boolean indexing: flights[flights[‘CANCELLED’] == 1]
  • Group all the cancelled flights by airline and find the size of each group.
  • Filter only those groups whose size is larger than 10,000, by using Boolean indexing on the Series object returned from the previous step.

The final solution is:

df = flights[flights['CANCELLED'] == 1].groupby('AIRLINE').size()
df[df > 10000]

And the output is:

AIRLINE
AA    10919
EV    15231
MQ    15025
WN    16043
dtype: int64

8. Find airlines having more than 2% of their flights cancelled. For each such airline, print its identifier and the percentage of cancelled flights.

The solution consists of the following steps:

  • Group the flights by airline.
  • Find the percentage of cancelled flights in each airline by calling the mean() method on the CANCELLED column of each group. Since this column contains only the numbers 0 and 1, the mean() method will return how many flights were cancelled by each airline divided by the total number of flights of that airline, which is exactly the percentage of cancelled flights.
  • Filter only the airlines that had a percentage of cancellations higher than 2%, by using Boolean indexing on the Series object returned from the previous step.

The final solution is:

df = flights.groupby('AIRLINE')['CANCELLED'].mean()
df[df > 0.02]

And the output is:

AIRLINE
EV    0.026629
MQ    0.050996
US    0.020466
Name: CANCELLED, dtype: float64

9. Find the three top airlines with the highest number of cancelled or diverted flights.

The solution here consists of the following steps:

  • Find all the flights that were either cancelled or diverted by using Boolean indexing: flights[(flights[‘CANCELLED’] == 1) | (flights[‘DIVERTED’] == 1)]
  • Count the number of flights each airline has in the DataFrame returned from the previous step, by applying the method value_counts() on the AIRLINE column. This method will return a Series object with the number of cancelled or diverted flights for each airline. The Series will be in descending order so that the first element would be the airline with the highest number of cancelled or diverted flights.
  • Return the three top airlines with the highest counts by using slicing [:3] on the Series object returned from the previous step.

The final solution is:

flights[(flights['CANCELLED'] == 1) | (flights['DIVERTED'] == 1)]['AIRLINE'].value_counts()[:3]

And the output is:

WN    19452
EV    17225
MQ    15841
Name: AIRLINE, dtype: int64

10. Find the longest sequence of on-time flights for each airline (an on-time flight is a flight with less than 15 minutes arrival delay).

The solution consists of the following steps:

  • Group the flights by airline.
  • Aggregate the ARRIVAL_DELAY column of each group using the agg() method with a custom function.

The custom aggregate function will do the following:

  • Find all the flights in the group with a delay of 15 minutes or more. This will return a Boolean array with True or False for each flight.
  • Use the cumsum() method to compute the cumulative sum of the Boolean values returned from the previous step. For example, if the array returned from the previous step is [False, True, True, False, False, True], then cumsum() will return [0, 1, 2, 2, 2, 3] (since False is treated as 0 and True as 1). Notice that when there is a sequence of flights with a delay of less than 15 minutes, the number in the cumulative sum array remains the same (since we have a sequence of False values).
  • Use value_counts() to find how many times each number appears in the cumulative sum array. These counts represent the lengths of the sequences of on-time flights.
  • Take the maximum of the value counts to get the longest sequence of on-time flight and subtract from it 1 (since cumsum() added an extra 1 for each sequence).

The final solution is:

flights.groupby('AIRLINE')['ARRIVAL_DELAY'].agg(
    lambda delay: (delay >= 15).cumsum().value_counts().max() - 1)

And the output is:

AIRLINE
AA    156
AS    110
B6    170
DL    207
EV    128
F9    163
HA    213
MQ    117
NK     63
OO    121
UA    161
US    103
VX    116
WN    302
Name: ARRIVAL_DELAY, dtype: int64

To understand the solution better, I suggest that you run each one of the steps above individually, and examine the results that you get after each step.

Final Notes

You can find the Jupyter notebook with all the solutions on my github: https://github.com/roiyeho/medium/tree/main/master_questions/pandas

Thanks for reading!

Pandas
Interview
Interview Questions
Python
Data Science
Recommended from ReadMedium