
Machine Learning or Econometrics?
To “Explain” or “Predict”?
Data science is like a big vacuum machine that attracts talents from related fields such as statistics, mathematics, computer science, and physics to itself. Econometrics is no exception. Many people may have heard of Econometrics. If this is the first time you heard it, its name is “Econo + Metrics” you may get the idea that it is about the applications of quantitative methods to economic data. However, because data science offers a wide range of tools and answers more questions, Econometrics seems to lose its shine. Nevertheless, there is one unique aspect that keeps Econometrics standing firm in its post—causality of economic data. In economic policy decisions, policymakers are primarily interested in the causal relationships of various economic phenomena. This is something that machine learning cannot do.
It is worth noting here that in the “identify causality” series of articles I cover econometric techniques designed to identify causality. These articles cover Regression Discontinuity (“Identify Causality by Regression Discontinuity”), Differences in differences, Panel data analysis, and Randomized Controlled Trials with Factorial Design (see “Design of Experiments for Your Change Management”). In each article, I present the applications in various fields so you see the formation of their problems. I also offer best practices, the sample code, and how to conclude. You can also bookmark “Dataman Learning Paths — Build Your Skills, Drive Your Career” to find more.
To Explain or Predict?
The starting point in a data analytic project is this: (1) to understand the relationships or (2) to get the best level of accuracy possible. Galit Shmueli in his article “to explain or to predict” suggests the distinction between explanatory and predictive modeling. “Explanatory modeling” uses statistical methods to test causal relationships. In contrast, “predictive modeling” is the process of applying a statistical model or data mining algorithm to data to predict new or future observations. As Jerome H. Friedman said in his article “one of the most common uses for data is prediction.” If the goal is to test the causal hypothesis, the “explanatory” purpose is more important than the predictive purpose, and vice versa. Econometrics, since its genesis, has been emphasized more on hypothesis testing and causality identification. In contrast, machine learning aims at prediction and has impressive success.
Understand the Causality in Model Design. Pursue Prevision in Model Estimation

To deliver an effective data science story-telling, you may want to address both the “business sense” and “model accuracy”. “Business sense” is about the causality between the dependent and explanatory variables; “model accuracy” is what’s required in cost-efficiency or profit maximization. How do we balance both? If it is about identifying the causality, we use the appropriate econometric models that can explore causality. When the interest is about precision accuracy and cost efficiency, use machine learning models. The cross-pollination between the two has produced a new approach as described in “Ensemble Methods for Causal Effects in Panel Data Settings” (AEA Papers & Proceeding, Athey et al. 2019).
What Machine Learning Can Learn From Econometrics?
Many analytic questions concern causality in nature. The causal questions require some designs of data generation and cannot be computed from the data alone. Look at the following questions:
- What is the efficacy of a given drug in a given population?
- What fraction of crimes can be avoided if a new policy is implemented?
- What was the cause of death of a patient given certain medical complications?
- How to use data analytics to prove that an employer is guilty of hiring discrimination?
Hal Varian, the Chief Economist at Google Inc., asks what an econometrician can learn from machine learning, and what machine learning can learn from econometrics. He lists the machine learning techniques (he called “new tricks”) for econometricians to adopt, and the econometric perspectives that the machine learning techniques can consider.
- Causal inference: The process of concluding a causal connection based on the conditions of the occurrence of an effect.
- Confounding variable: A confounding variable is an outside influence that changes the effect of a dependent and independent variable. For example, if you are researching whether lack of sleep leads to weight loss, lack of sleep is your independent variable and weight loss is your dependent variable. Confounding variables are any other variable that also affects your weight loss. See “Identify Causality by Fixed Effects Models”.
- Natural experiments: A natural experiment is an empirical study in which individuals are exposed to the experimental and control conditions that are determined by nature or other factors outside the control of the investigators. The simplest form is similar to the random assignment.
- Regression discontinuity design (RD): Popular in econometrics, political science, and epidemiology, a regression discontinuity design identifies the causal effects of interventions for those who are above and below a threshold. For example, do students with higher-score peers result in better academic outcomes, despite the same teachers, curriculum, and textbooks for all classrooms? An RD can be conducted to find the reasons for the differences between the students whose scores are above and below the threshold. See “Identify Causality by Regression Discontinuity”.
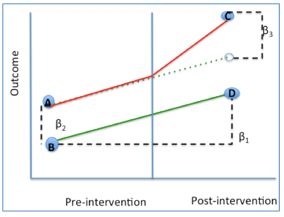
- Difference in differences (DID): DID is a quasi-experimental design to estimate the causal effect of a specific intervention or treatment (such as a passage of the law, enactment of policy, or large-scale program implementation) by comparing the changes in outcomes over time between a population that is enrolled in a program (the intervention group) and a population that is not (the control group). See the Exhibit showing the outcome differences before and after an intervention. See “Identify Causality by Difference in Differences”.
- Instrumental variables: An instrumental variable is a third variable, Z, used in regression analysis when you have endogenous variables — variables that are influenced by other variables in the model. The instrumental variable is used to account for unexpected behavior between variables.
Difference of differences has wide applications in economic policy evaluations. Click this video to see the applications.
What Econometrics Can Learn From Machine Learning?
Econometrics can learn many data science hand tools: Train-test-validate to avoid overfitting, Cross-validation, Bootstrap, bagging, and boosting. The open-source software for manipulating big data (SQL, NoSQL databases) is very important too. In addition, the following topics are worth mentioning:

- Regularization to Avoid Overfitting: Complex models tend to fit the training data too well but fail to fit unknown data. Regularization techniques build in the loss function to penalize a model with too many parameters. The word “regularization” means to make the prediction regular or acceptable, so it can predict unknown data.
- Model averaging: A specific technique to improve predictive ability by combining predictions from a set of models. For example, it is used to average regression coefficients across multiple models with the ultimate goal of capturing a variable’s overall effect.
- Markov chain Monte Carlo (MCMC): it creates samples from a continuous random variable with probability density proportional to a known function. These samples can be used to evaluate the expected value or variance of that variable.
- Textual analysis: A way for researchers to gather information about how other human beings make sense of the world. It is a data-gathering process to understand how members of various cultures and subcultures make sense of how they think. See this article “Looking into Natural Language Processing” for more discussion.

Many business management problems need both the identification of the causal effects and accurate prediction. The current research has emerged from melting the two schools of thought. (For example, the article “explain your model with the SHAP values” helps you to visualize your machine learning model.) This melting trend can be seen plausibly in the increasing number of job articles at the American Economic Association conferences in recent years.
It is worth noting here that in the “identify causality” series of articles I cover econometric techniques designed to identify causality. These articles cover Regression Discontinuity, Difference in differences, Panel data analysis, and Randomized Controlled Trials with Factorial Design:
- Machine Learning or Econometrics? (see “Machine Learning or Economics?”
- Regression Discontinuity (see “Identify Causality by Regression Discontinuity”),
- Difference in differences (DiD)(see “Identify Causality by Difference in Differences”),
- Fixed-Effects Models (See “Identify Causality by Fixed-Effects Models”),
- Randomized Controlled Trial with Factorial Design (see “Design of Experiments for Your Change Management”).
If you like to know more about the design of experiments (DoE), please read my post “Design of Experiments for Your Change Management”. That article provides a step-by-step guide on how to conduct the Design of Experiments (DoE). Don’t miss it!


