
How to Use Chrome DevTools to Debug Unit Test Cases
Better debugging with Chrome DevTools

How do you debug unit test cases? There are two popular methods:
- Use the built-in capability of Visual Studio Code (commonly known as VS Code)
- Use Chrome the DevTools built-in debugger
In this article, we’re going to cover the second method: Using Chrome DevTools to debug unit test cases.
What is Node.js? It’s an open-source and cross-platform JavaScript runtime environment. It can be interchangeably called NodeJS, nodejs, or node. It is a popular tool for Web development. Node.js runs the V8 JavaScript engine, the core of Google Chrome, outside the browser. This allows us to use Node.js and Chrome DevTools to debug unit test cases.
Debug the Original Create React App Unit Test Cases
Let’s use Facebook’s famous Create React App as an example. There’s one unit test file, src/App.test.js, in the codebase:
As we have described in “Use Visual Studio Code to Debug Unit Test Cases”, you can run this command: npm run test.
PASS  src/App.test.js
✓ renders without crashing (3ms)
Test Suites: 1 passed, 1 total
Tests:       1 passed, 1 total
Snapshots:   0 total
Time:        0.056s, estimated 1s
Ran all test suites related to changed files.
All tests passed.
However, we want to have a method to debug unit test cases. The second method is to use the Chrome DevTools debugger.
A script for test:debug is added to package.json:
"scripts": {
  "start": "react-scripts start",
  "build": "react-scripts build",
  "test": "react-scripts test",
  "test:debug": "react-scripts --inspect-brk test --runInBand --no-cache --watchAll=false",
  "eject": "react-scripts eject"
}
Compared to the "test" script, the "test:debug" script has additional options.
--inspect-brk: It is Node.js option to enable the inspector agent and listens on default address and port (127.0.0.1:9229, they can be configured by [host:port]). Compared to--inspect,--inspect-brkadds a breakpoint before the user code starts.—-runInBand: Alias-i. This is a Jest option to run all tests serially in the current process, rather than creating a worker pool of child processes that run tests. This is used for debugging environment.--no-cache: Disable cache. This is a Jest option to disable the cache. On average, disabling the cache makes Jest at least two times slower.--watchAll=false: It’s a Jest option not to run a watch file for changes and rerun all tests when something changes.
Running this command will start a node process for unit test cases:
$ npm run test:debug> [email protected] test:debug /Users/fuje/codeTemp/react-app
> react-scripts --inspect-brk test --runInBand --no-cache --watchAll=falseDebugger listening on ws://127.0.0.1:9229/d50dfe5e-d0b2-4032-a6d6-bf9dedf8fd85For help, see: https://nodejs.org/en/docs/inspectorOpen chrome://inspect in a Chromium-based browser (edge://inspect in Edge):
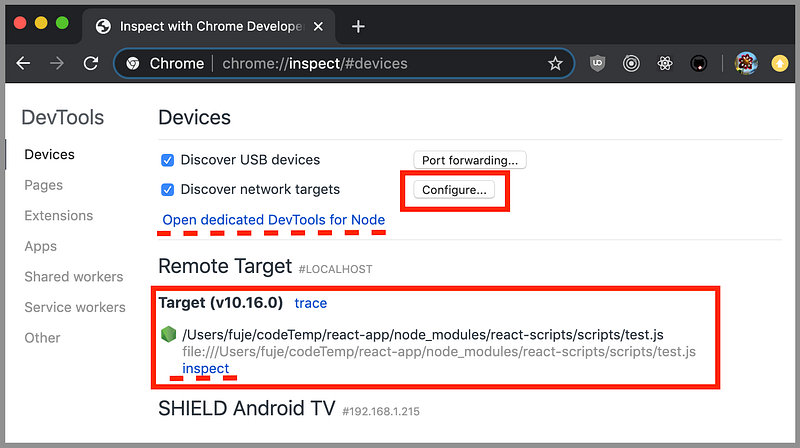
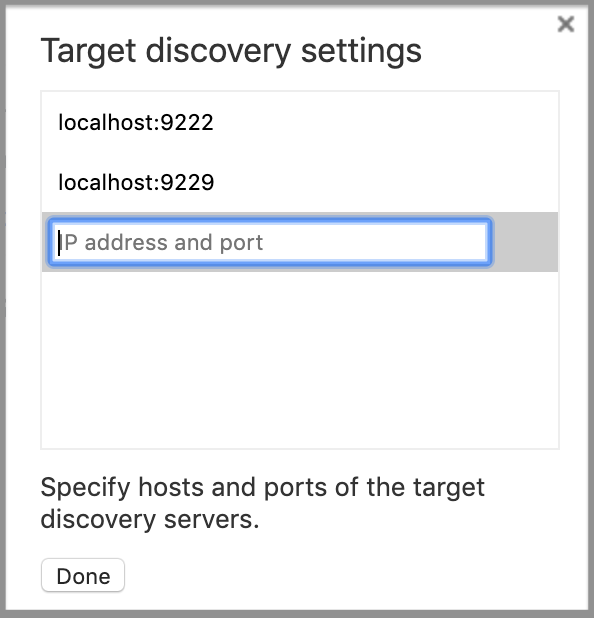
Click the Configure button, marked with a smaller red box. This shows the target discovery settings. Make sure the default address and port (127.0.0.1:9229) or specified [host:port] is configured. Here the localhost is 127.0.0.1.
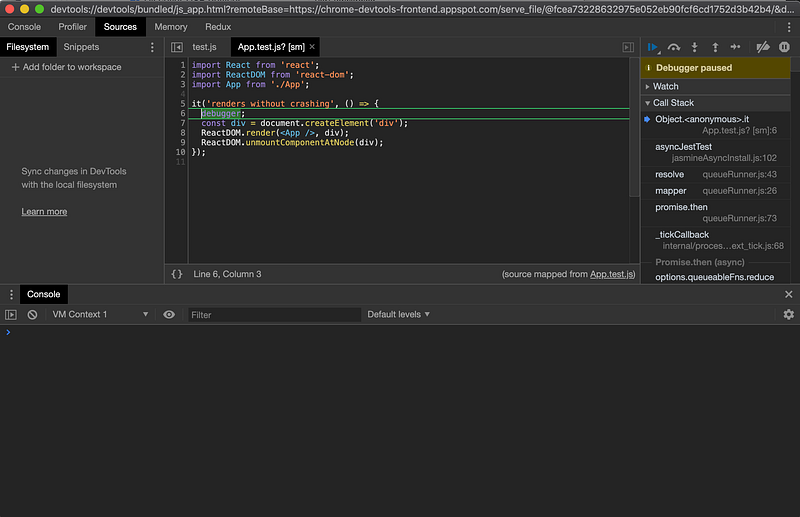
When npm run test:debug is running, the larger red box shows the target. You can click the link, inspect, above the dashed red line. Or you can click the link, Open dedicated DevTools for Node, above the dashed red line. It pops up the debug window that breaks at the first line of code.

Clicking the continue button for debugging, unit tests finish successfully:
$ npm run test:debug> [email protected] test:debug /Users/fuje/codeTemp/react-app
> react-scripts --inspect-brk test --runInBand --no-cache --watchAll=falseDebugger listening on ws://127.0.0.1:9229/d50dfe5e-d0b2-4032-a6d6-bf9dedf8fd85
For help, see: https://nodejs.org/en/docs/inspector
Debugger attached.
PASS src/App.test.js
✓ renders without crashing (19ms)
Test Suites: 1 passed, 1 total
Tests: 1 passed, 1 total
Snapshots: 0 total
Time: 4.711s
Ran all test suites.Waiting for the debugger to disconnect...But how can we debug?
It turns out that we have to add debugger statements in test cases to enable breakpoints.
When you finish, remember to close the debugger.
This is the complete solution on how to use Chrome DevTools to debug unit test cases.
Bonus step
It seems like a lot of manual steps are needed to do this method. How can we automate the process?
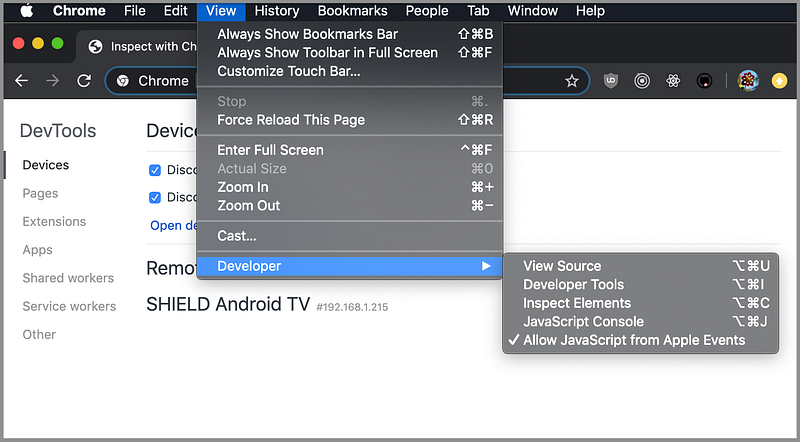
nodevtools is a helper. It’s a small AppleScript script to open Chrome DevTools for node from the command line interface. Since nodevtools is an AppleScript script, it only works in Mac OS X or OS X. Also, this option needs to be enabled.
These are the steps to install nodevtools:
brew tap rcoedo/tap
brew install nodevtools
Enabling AppleScript and installing nodevtools are one time tasks. Here’s the final package.json:
Line 14 is a must to use Chrome DevTools for debugging unit test cases.
Line 15 —16, and line 34 — 36 are implementations for the bonus step. We use npm-run-all to run multiple NPM scripts in parallel.
With all these, you can start everything by typing npm run test:debugAll.
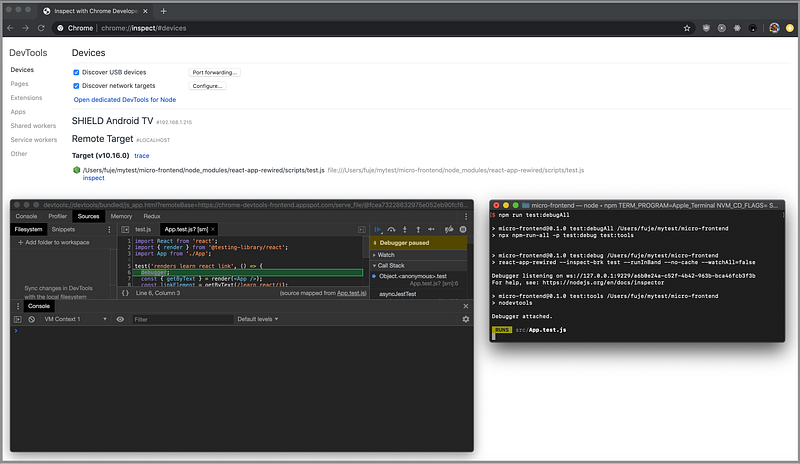
Debug the Rewired Create React App Unit Test Cases
For a project using the rewired Create React App (See Fun Fact #5 About Create React App), we follow the same steps and use the following package.json:
Line 18 is a must to use Chrome DevTools for debugging unit test cases. Here the executable is react-app-rewired. It can be invoked by typing npm run test:debug.
Line 19 — 20, and line 38 — 40 are implementations for the bonus step. Here is the screenshot for npm run test:debugAll.
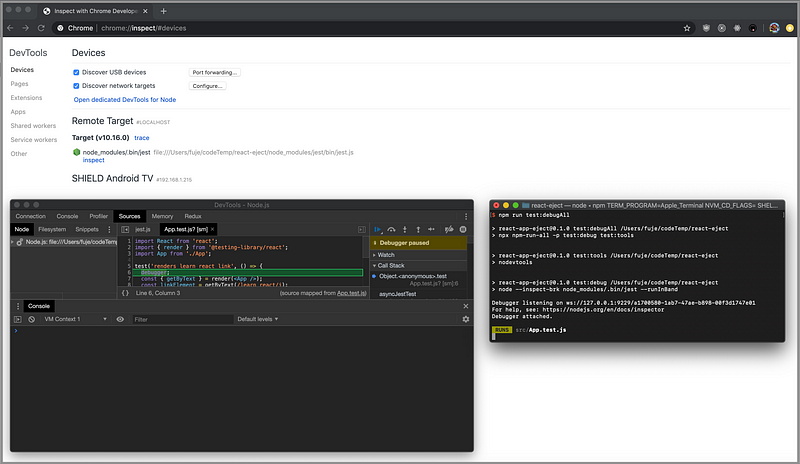
Debug the Ejected Create React App Unit Test Cases
We use the ejected Create React App as an example. This shows how to debug regular JavaScript unit test cases. The same steps are followed. Here’s the package.json:
Line 68 is a must to use Chrome DevTools for debugging unit test cases. Here the executable is node, which calls jest. It can be invoked by typing npm run test:debug.
Line 69 — 70, and line 142 — 144 are implementations for the bonus step. Here is the screenshot for npm run test:debugAll:
Debug Options for Unit Test Cases
Similar to use VS Code debugging unit test cases, we can set more options for Jest. Let’s see a few examples with the modified App.test.js in the ejected Create React App codebase:
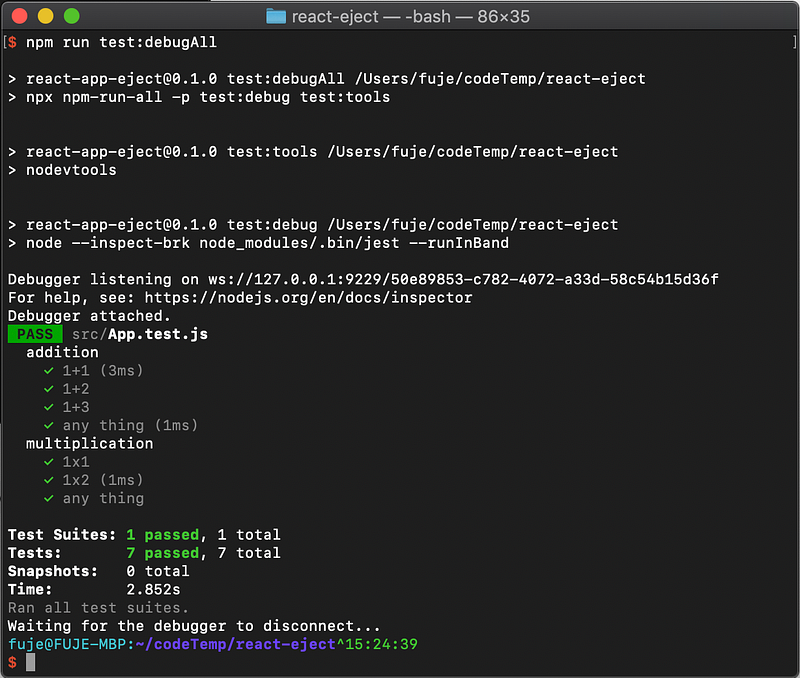
By default, npm run test:debugAll runs all test cases:
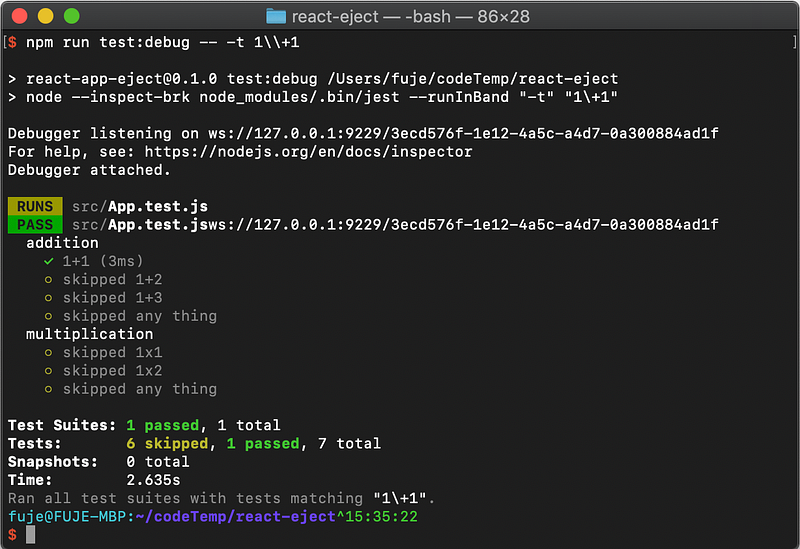
We can match unit test names using option "--testNamePattern=<regex>". Alias: -t <regex>. It runs only tests with a name that matches the regex.
"-t <regex>" can be used to start named test cases.
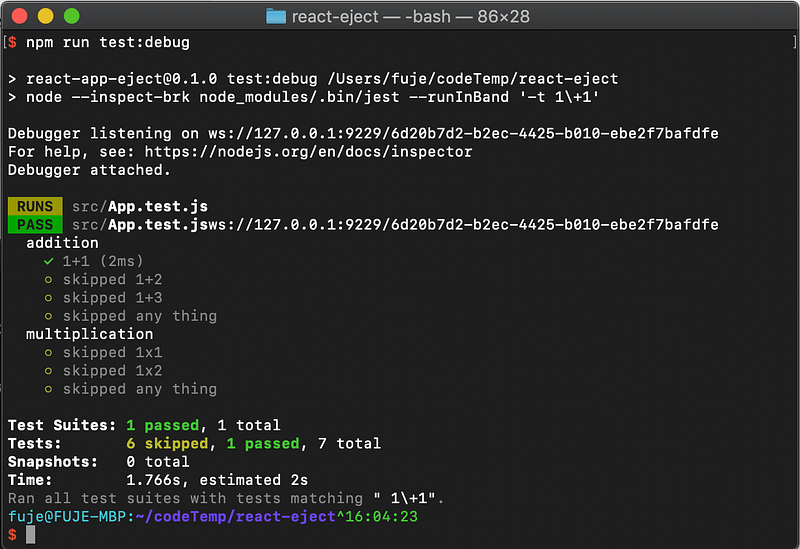
By not changing package.json, we can pass command line arguments to npm script: npm run test:debug —- -t 1\\+1.
However, test:debugAll will not work with the command-line argument as npm-run-all cannot pass command line arguments to each script.
We have to make changes to package.json:
“scripts”: {
  "test:debug": "node --inspect-brk node_modules/.bin/jest --runInBand '-t 1\\+1'"
}
npm run test:debug works:
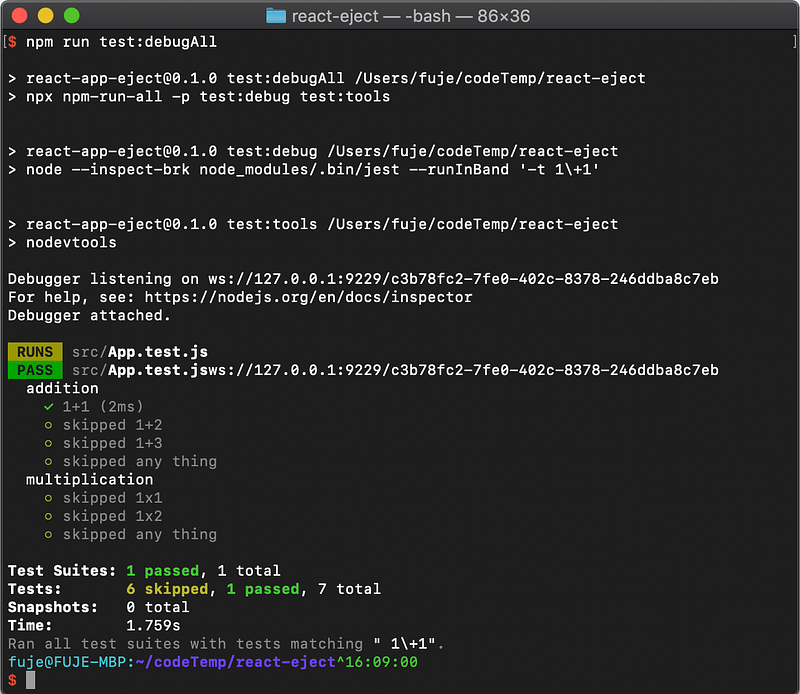
npm run test:debugAll works as well:
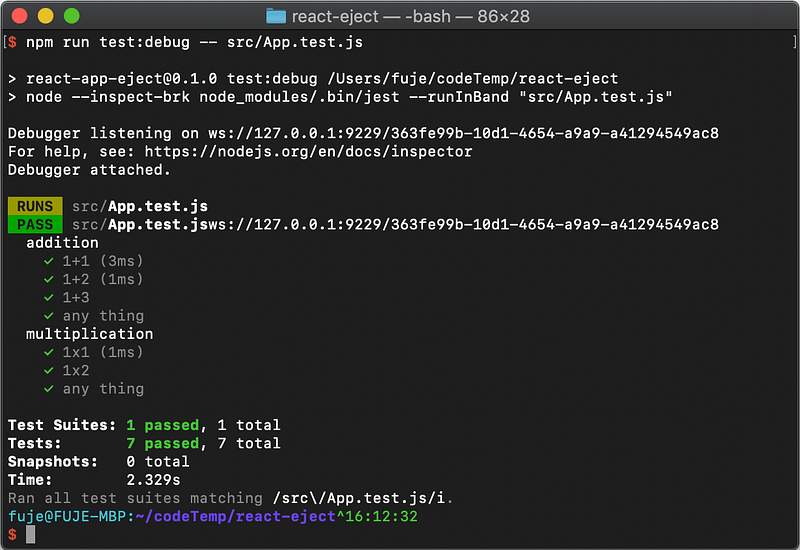
Similarly, a file name can be matched:
A directory name can also be matched:
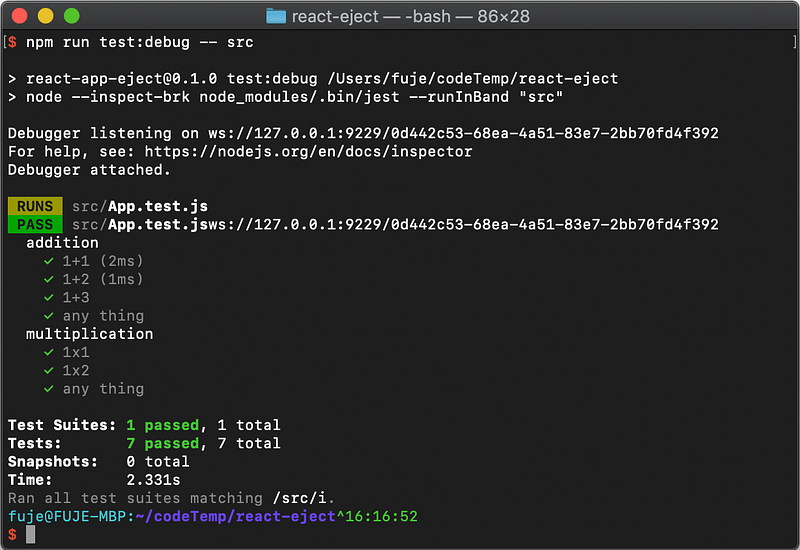
Isn’t that cool?
If you want to try more advanced Jest options, go to the Jest official site for more details.
Caveats
Generally, Chrome DevTools debugger works well. npm run test:debug is more stable than npm run test:debugAll. Occasionally, Ctrl-C an on-going process or forgetting to close a finished debugger might cause some issues. But we can work around these minor issues:
- If
chrome://inspectis not up, startchrome://inspectin a new tab/window. - If
chrome://inspectis up without the debugger window, click one of the two links to inspect. - There might be leftover debugger windows. Simply close them.
- There might be multiple inspect tabs. Simply close them (for bonus step).
- As a last resort, restart your terminal that runs
npm run test:debugAll(for bonus step).
Thanks for reading. I hope this was helpful. If you have any questions, feel free to leave a response. You can see my other Medium publications here.


