
How to Trade without Indicators
Only Price Action Matters
There are different types of traders. One way to differentiate between them is to separate those who use technical indicators from those who do not.
Both ways are respectable and can be profitable if done well. However, for my part, I prefer to use as few technical indicators as possible. I will explain why, and I will also explain how you can trade without technical indicators.
Why Not Use Technical Indicators
Technical Indicators are Not for Beginners
Some technical indicators are extremely popular and used by a lot of retail traders. Yet, a large portion of these traders is not profitable.
Technical indicators can be extremely useful, but it is not enough to apply signals found on the internet. It is necessary to understand how they work, how they are calculated, etc…
One common mistake all beginners make is just applying random signals triggered by technical indicators instead of focusing on the most important: the price.
Price is the Most Important Indicator
All technical indicators come from mathematical calculations derived from the price. So, the information a technical indicator gives you can be read in the price.
In addition, most of the indicators are lagging. It means they don’t reflect the market at the time you’re seeing them because they need historical price data to be computed.
So, it’s better to focus on price as it reflects most of the market information at the time you’re watching it!
Indicators Make Things Harder
If you don’t know what you’re doing, you can end up with so much information on your screen that it becomes a mess.
This can lengthen your reaction time and make it more difficult to think and take decisions. If on top of that you have to analyze several timeframes, and several assets, your brain has to process much more information than if your chart was empty.
Indicators Don’t Work Every Time
If you’ve studied indicators a bit, you should know that some of them only work when the market is trending, ranging, when it opens, etc…
There are many variables that can make them useless at the time you’re using them. On the other side, price always works. Obviously, you have to adapt your strategy and find setups compatible with the market, but you can be sure that price will rarely send false signals, no matter the market conditions.
Market Psychology is Stronger than Indicators
Technical indicators would be super effective if everyone used them because then everyone would see the same signals and act the same way.
However, this is not the case. Everyone uses different indicators, with different configurations.
On the other hand, everyone sees the same price and can react accordingly (even if supports and resistances are rather subjective).
How to Trade without Technical Indicators
You have many ways to trade without indicators. Let’s cover some of them.
Support and Resistances
It is not for nothing that this concept is one of the best-known when it comes to trading. It is also one of the most effective.
A support is a level that supports the market. Usually, the market will bounce off a support. But a support can also be a level that has not been reached, such as a Fibonacci level or a round number.
Around a support, buyers are often stronger than bears. That is why it is the ideal place to buy if the market diagnosis is bullish or the ideal place to sell and take profits.
A resistance is simply the opposite of a support, it is a level that resists the market.
In a trendless market, the price will swing between major supports and resistances. A support or resistance remains valid even if it has not been touched for a long time.
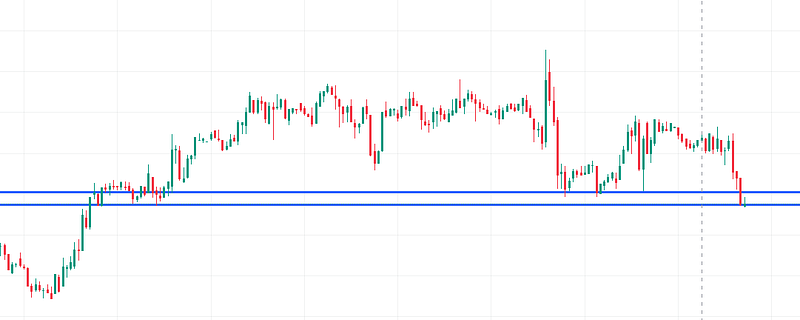
Supports and resistances are usually drawn as lines, but I think it’s more relevant to draw them as zones. Indeed, as they are subjective, there is no specific accurate place for a support or a resistance, so it’s better to consider a zone when talking about a support or a resistance.
Here are some principles about zones:
- Zones are an area, not a point.
- Zones get better with age.
- Zones are spots where price reverses.
- Zones may be extreme highs or lows.
- Line charts help to find zones.
- If the market touches a zone twice in succession, it will probably move away from the zone.
- Two touches on a zone from above suggest a market bottom.
- Two touches on a zone from below suggest a market top.
- A bullish candlestick on a support zone suggests the market will trade higher.
- A bearish candlestick on a resistance zone suggests the market will trade lower.
To find zones, you should look at where the market bounces. To find zones on lower timeframes, consider first trying to find them on higher timeframes. You can also use a line chart to find them more easily.
Patterns
In addition to support and resistances, you can try to identify patterns. Some very popular patterns are Double Top or Double Bottom. There is also the Head and Shoulders pattern.
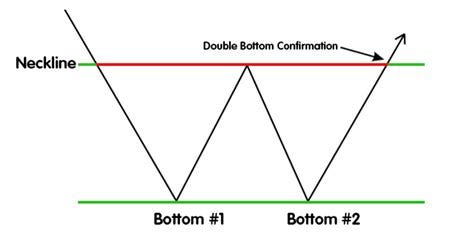
All these patterns make sense and are not just random price movements. For example, here is how you can explain a Double Bottom:
In a downtrend, some traders anticipate the end of the downtrend and buy. However, the bears retaliate, but fail to break the old low. This allows traders to see that the market is reacting well, so they will open positions and be strong enough to break the neckline.
For the Double Top, it’s the opposite. There are also patterns like Flags or Triangles, representing uncertainty.
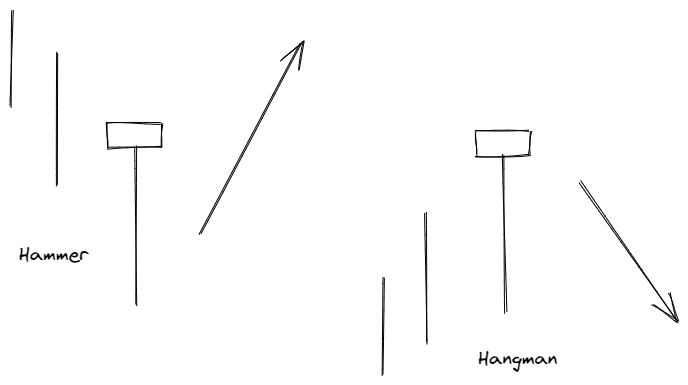
Then, you also have candlestick patterns. Perhaps you know what a Doji is? It’s a candle with a small body, but large shadows. It represents uncertainty. The Hammer or the Hangman represent trend reversals.
Here is the list of all the candlestick patterns I know:
- Doji
- Hammer and Hangman
- Inverted Hammer and Shooting Star
- Evening and Morning Star
- Advancements
- Black Cloud and Penetrator
- Harami
- Stalling Structure
- Line of Counterattack
- Three Methods
- Flat Bottom Structure
- Belt Passing
- Marubozu Figure
I won’t explain each one for now (perhaps in another story?). In the meantime, you can make your own research to study these patterns (I’m not sure about their names as I studied them in french, so the translation may be incorrect).
Elliott Waves
Elliott Waves are one of my favorite concepts to trade without indicators. If you don’t know what they are, I’ve written some stories about them:
- Improve your Trading with Elliott Waves — 1. Basics
- Improve your Trading with Elliott Waves — 2. Patterns
SMC/ICT
SMC stands for Smart Money Concepts. ICT stands for Inner Circle Trading. They are different styles of trading, all based on price action and trading without indicators.
I don’t know them much more so I won’t talk about them, but I let them here if you want to do your own research.
Final Note
As you can see, there are many different ways to trade without indicators. You can also trade with indicators if you want. All that matter is to find a trading style suiting you.
If indicators work for you, keep indicators. Your objective should just be to find a profitable trading strategy respecting your constraints, no matter how it works.
To explore more of my trading stories, click here! You can also access all my content by checking this page.
If you liked the story, don’t forget to clap, comment, and maybe follow me if you want to explore more of my content :)
You can also subscribe to me via email to be notified every time I publish a new story, just click here!
If you’re not subscribed to medium yet and wish to support me or get access to all my stories, you can use my link:
A Message from InsiderFinance

Thanks for being a part of our community! Before you go:
- 👏 Clap for the story and follow the author 👉
- 📰 View more content in the InsiderFinance Wire
- 📚 Take our FREE Masterclass
- 📈 Discover Powerful Trading Tools