
How To Log NestJS Applications in a Distributed System with Loki Stack — Part 2
Collecting Logs with fluentbit and showing them in Grafana
In one of my latest articles, I explained the importance of Centralized Logging. I demonstrated how you can realize custom logging in a NestJs application using winston and described the main role of fluentbit and Loki.
In this article I want to show you how you can collect custom and stdout logs, push them into a Loki database, and visualize them in Grafana.
Creating a Kubernetes Cluster for Local Use
To become more experienced with Kubernetes and improve our workflow, installing a local Kubernetes environment is key. For this, I use kind in most cases. Check out one of my articles to become familiar with kind.
We can use the following configuration file to configure a local Kubernetes cluster with one control-plane and two worker-nodes.
# kind.config.yaml

kind: Cluster
apiVersion: kind.x-k8s.io/v1alpha4
name: nestjs-logging

nodes:
- role: control-plane
- role: worker
- role: worker
Now we can start the Kubernetes cluster through kind with the following command:
kind create cluster --config=kind.config.yaml
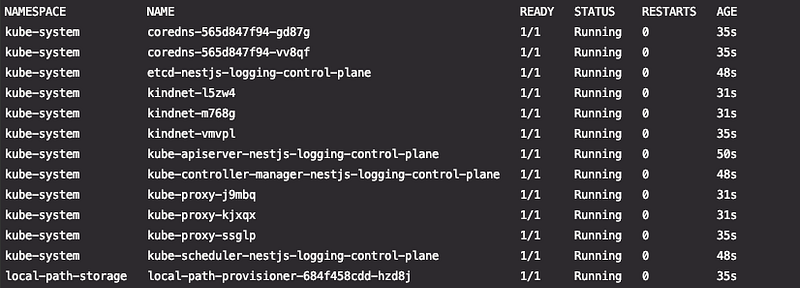
After initialization of the cluster, the .kubeconfig will automatically be appended to the profile directory, so we can run kubectl commands like kubectl get pods -A.
After we finish our work, we can delete the cluster with the following command.
kind delete cluster --name nestjs-logging
Creating a local Kubernetes cluster will be the basis for this article. We have to ensure that Docker and kind are installed, as well as kubectl CLI and Helm.
Collecting stdout logs with Loki Stack in Kubernetes
Collecting stdout logs is very simple with Loki-Stack and Helm, because the helm chart is preconfigured. So, fluentbit, Loki, Prometheus, and Grafana are already connected out of the box.
After we have created a local Kubernetes cluster with kind, we can deploy the Loki Stack on it using the following commands.
helm repo add grafana https://grafana.github.io/helm-charts
helm repo update

helm upgrade --install loki grafana/loki-stack \
--set fluent-bit.enabled=true,promtail.enabled=false,grafana.enabled=true,prometheus.enabled=true
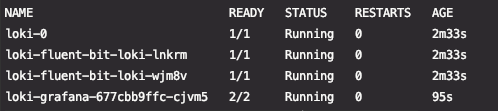
After a few seconds, we can see running pods in the default namespace with kubectl get pods.
To access the Grafana UI, run the following command to forward Grafana’s default port 80 to port 3000 for local use:
kubectl port-forward service/loki-grafana 3000:80
Now we can hit http://localhost:3000/login in our browser to access Grafana.
To get the admin password for the login page, we need to run the following command.
kubectl get secret loki-grafana -o jsonpath="{.data.admin-password}" | base64 --decodeNow we can enter admin as username and the password from the command line.
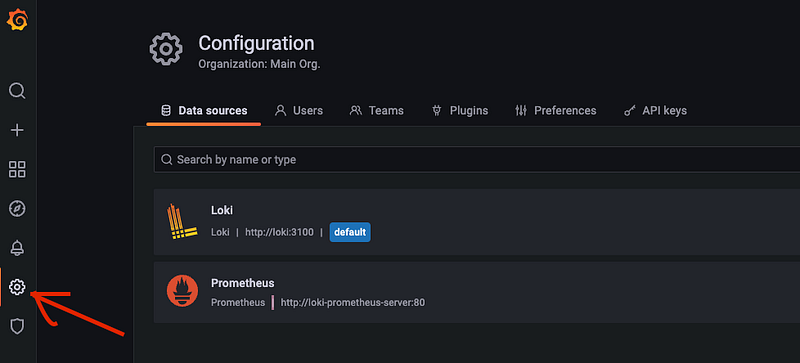
After we navigated to the datasource page, we can see that Loki and Prometheus datasources are preconfigured.
Now, we have the possibility to import different Grafana dashboards for Loki.
After importing, we see stdout logs in the dashboard:
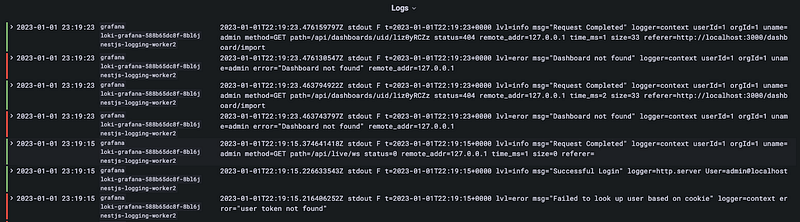
To delete all the created dependencies, we can run the following command. For the custom-log approach below, we will build a separate helm chart.
helm uninstall loki
Collecting custom logs with Loki Stack in Kubernetes with a Sidecar
The other way is using a sidecar pattern and running a log-forwarding container next to the application container within the same pod. We need to use this pattern because winston writes its logs to the filesystem. Also, sidecars extend the functionality of a main container without changing it. The application logs will be transferred to the Loki database via a fluentbit sidecar container.
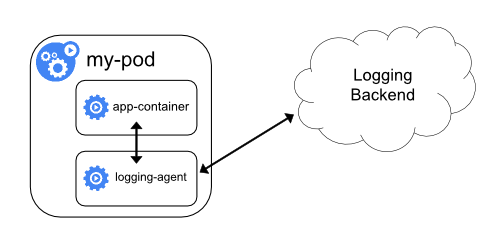
The logs of the main container are shared with the sidecar container via an emptyDir Volume.
apiVersion: apps/v1
kind: Deployment
# ...
spec:
  template:
    spec:
      containers:
         - name: main-container
           # ...
           volumeMounts:
            - name: log-volume
              mountPath: /usr/app/logs
         - name: sidecar-container
           # ...
           volumeMounts:
            - name: log-volume
              mountPath: /usr/app/logs
      # ...
      volumes:
        - name: log-volume
          emptyDir: { }
After we have created a local Kubernetes cluster with kind (see above), we can use a custom helm chart to deploy the Loki Stack and two NestJS microservices that generate some custom logs. The deployment can be found here.
To install this chart we need to run the following command.
helm upgrade --install loki loki
Now many different pods get spawned:
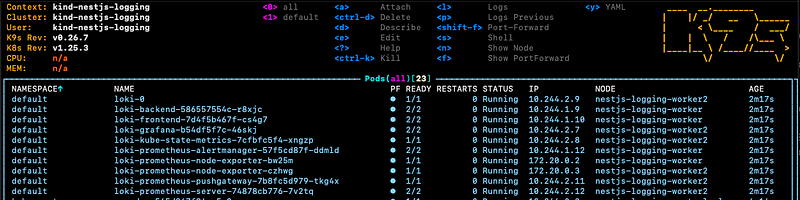
The connections between these microservices are shown in this architecture overview:
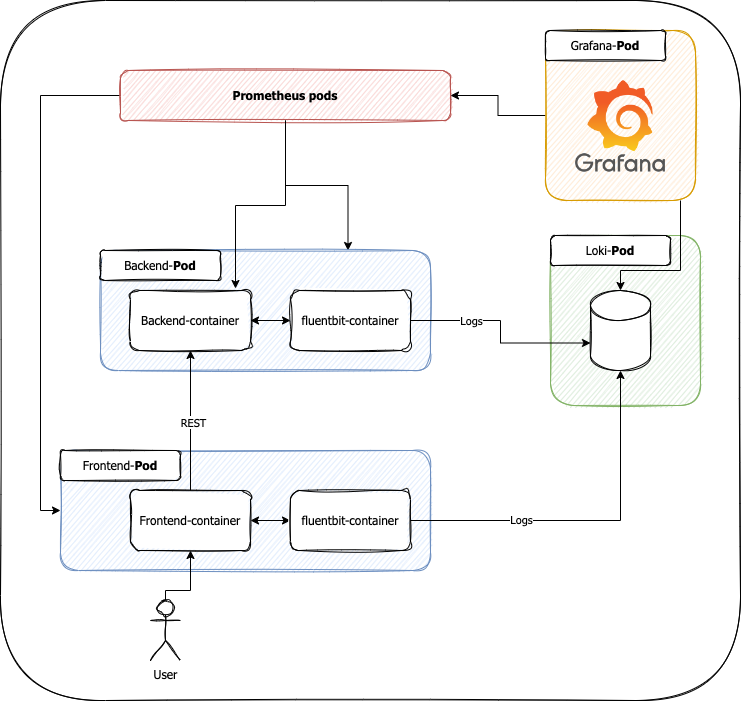
So, our frontend and backend service write logs to /usr/apps/logs in the filesystem. The task of our sidecar is to take these logs and send them on. For this we use a simple fluentbit container:
apiVersion: apps/v1
kind: Deployment
# ...
spec:
  template:
    spec:
      containers:
        - name: main-container-with-winston
          # ...
          volumeMounts:
          - name: log-volume
            mountPath: /usr/app/logs
          # ...
        - name: fluentbit
          image: "fluent/fluent-bit:2.0.8-debug"
          ports:
            - name: metrics
              containerPort: 2020
              protocol: TCP
          env:
            - name: FLUENT_UID
              value: "0"
          volumeMounts:
            - name: config-volume
              mountPath: /fluent-bit/etc/
            - name: log-volume
              mountPath: /usr/app/logs
      volumes:
        - name: log-volume
          emptyDir: { }
        - name: config-volume
          configMap:
            name: fluentbit-sidecar
Like a fluenbit DaemonSet the container needs a configuration mounted via a ConfigMap:
# sidecar.configmap.yaml

kind: ConfigMap
apiVersion: v1
metadata:
  name: fluentbit-sidecar
data:
  fluent-bit.conf: |
    [SERVICE]
        HTTP_Server    On
        HTTP_Listen    0.0.0.0
        HTTP_PORT      2020
        Flush          1
        Daemon         Off
        Log_Level      warn
        Parsers_File   parsers.conf

    [INPUT]
        Name tail
        Path /usr/app/logs/*.log
        multiline.parser docker, cri
        Tag custom.*
        Mem_Buf_Limit 300MB
        Skip_Long_Lines On

    [FILTER]
        Name         parser
        Parser       docker
        Match        custom.*
        Key_Name     log
        Reserve_Data On
        Preserve_Key On

    [FILTER]
        Name modify
        Match *

    [OUTPUT]
        Name loki
        Match *
        Host loki.default.svc.cluster.local
        Port 3100
        tenant_id ""
        Labels job=fluent-bit

  parsers.conf: |
    [PARSER]
        Name   docker
        Format json
        Time_Key time
        Time_Format %d/%b/%Y:%H:%M:%S %z
        Decode_Field_As   escaped_utf8    log    do_next
        Decode_Field_As   json       log
As we can see, the fluentbit container observes Paths usr/app/logs/*.log.
Very import is changing the [Output.Host] to the host of our needs. In this case the host represents the Kubernetes Service of Loki with Port 3100.
We can further customize the output plugin by following the official documentation:
We could add more labels or label_keys. Or we could add an additional filter to add custom labels or service names:
[FILTER]
    Name modify
    Match *
    Add service_name database-service
After all pods are initialized we can portforward the Grafana container and login with the username admin after we get the credentials via the next command:
# Portforward
kubectl port-forward service/loki-grafana 3000:80
# Get admin password
kubectl get secret loki-grafana -o jsonpath="{.data.admin-password}" | base64 --decode
# Open Grafana-UI
open http://localhost:3000/login
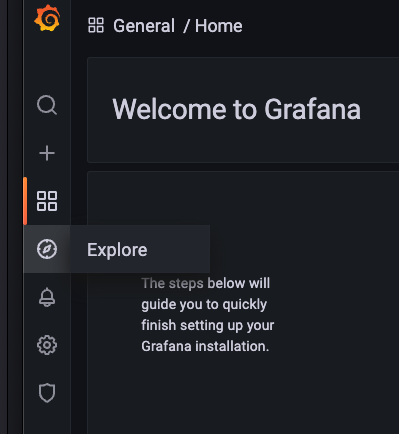
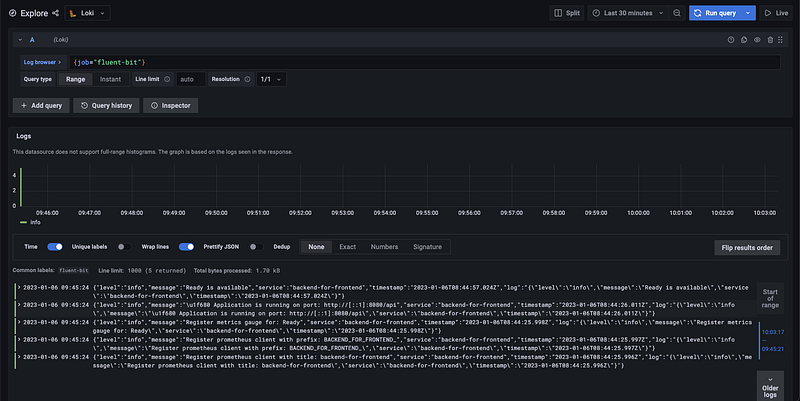
In Grafana we can navigate to the Explore panel and add our fluentbit output job {job=”fluent-bit”}:
After entering the query {job=”fluent-bit”} and hitting Run Query button we can see the custom logs generated by the NestJs applications:
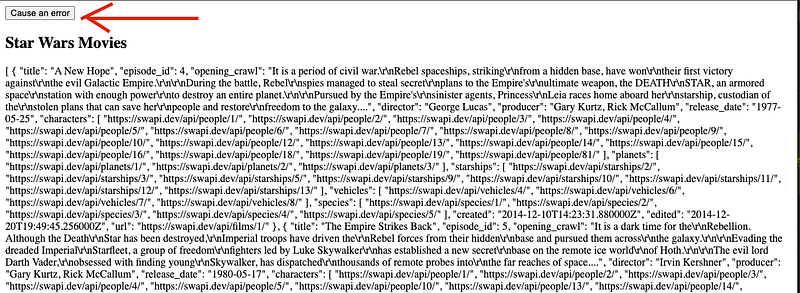
We can also generate some error logs with the frontend and backend apps. For this, we need to portfoward the port to get access via localhost:
# portforward
kubectl port-forward service/loki-frontend-service 8080:80
# Open UI
open http://localhost:8080
This application gets some information about Star Wars from the backend app. To cause some errors, we need to hit the Cause an error button:
After refreshing the query in Grafana, we can see the error logs:
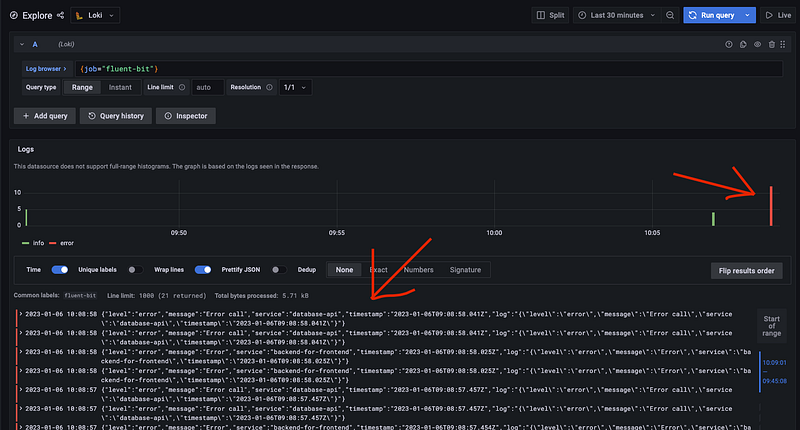
Note, however, that we are in the Explore section of Grafana — this is not a manifested dashboard.
Creating a Grafana Dashboard for Custom Logs from Loki
As shown above, we can tag the logs with a specific label in fluentbit using Labels job=fluent-bit.
[OUTPUT]
        Name loki
        Match *
        Host loki.default.svc.cluster.local
        Port 3100
        tenant_id ""
        Labels job=fluent-bit
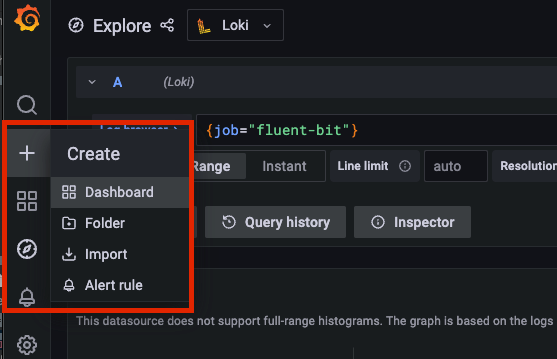
These Labels are our variables for a custom Grafana dashboard. For this we need to go to Create -> Dashboard in Grafana:
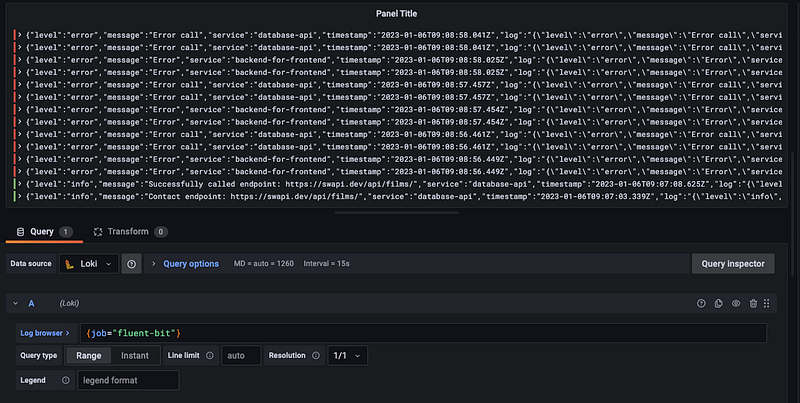
Next, we press Add a new panel, select Loki as data source, and enter the Log browser metric {job=”fluent-bit”}:
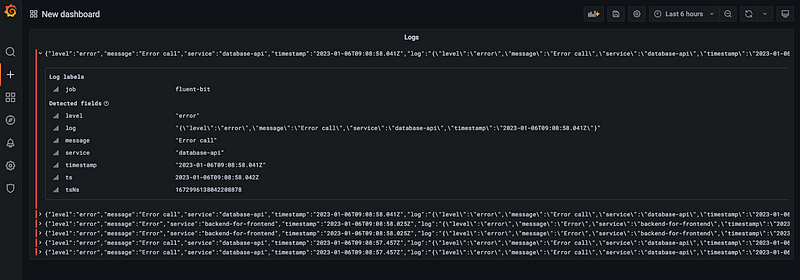
After Apply we have a custom log dashboard:
This is a very simple guide to create a dashboard. There are more possibilities to add some nice graphics and so on.
Conclusion
Logging has a central role in distributed systems, and in case of system failures, we want to have an overview to see which applications generate certain messages.
Fluentbit, Loki, and Grafana help us to generate this approach. With fluentbit we have the possibility to customize our logs via the output plugin. We can add additional labels and tags.
But consider that audit logs can be very noisy, and it can be very expensive to log all actions. For this, we can generate custom logs collected via a sidecar to fine-tune this approach for our environment.
In the next part I will show you how to create a local Kubernetes cluster with kind, and how to deploy the EFK Stack via Helm charts in it. Also, I show the use case for a Sidecar container to collect custom logs.
Thanks for reading! Follow me on Medium, Twitter, or Instagram, or subscribe here on Medium to read more about DevOps, Agile & Development Principles, Angular, and other useful stuff. Happy Coding! :)


