
How to decide the number of clusters | Data Science Interview Questions and Answers
Elbow method, Silhouette score, Hierarchical graph, AIC & BIC from GMM, Gap statistics, and when to use which method

In data science and machine learning interviews, how to decide the number of clusters for an unsupervised model is one of the most commonly asked questions. In this tutorial, we will talk about five ways for deciding the number of clusters and when to use which. The five methods are:
- Elbow method
- Silhouette score
- Hierarchical graph
- AIC & BIC from GMM (Gaussian Mixture Model)
- Gap statistics
Resources for this post:
- Video tutorial for this post on YouTube
- Click here for the slides
- More video tutorials on Data Science Interview Questions
- More blog posts on Data Science Interview Questions
Let’s get started!
Method 1: Elbow method
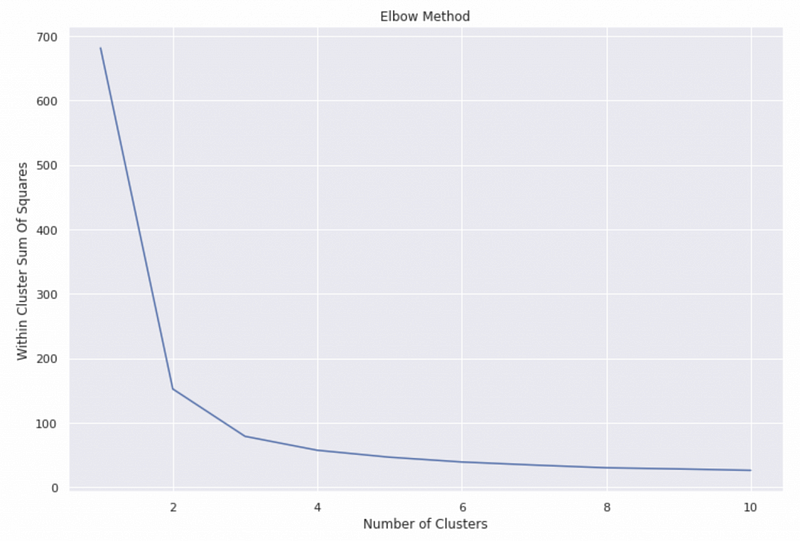
The elbow method is the most widely used method for choosing the number of clusters. It runs clustering models for a range of cluster numbers and plots the within-cluster sum of squares. The number of clusters at the elbow of the plot represents the starting point of the diminishing return for additional clusters, so it is the optimal number of clusters for the clustering model.
Example
From the example graph, we can see that the biggest decrease in the within-cluster sum of squares happens at 2 clusters, and there is a relatively large decrease from 2 to 3 clusters. The decreases are small for the models with the number of clusters greater than 3. Therefore, we can conclude that the optimal number of clusters is probably 2 or 3.
Method 2: Silhouette Score
The silhouette score measures how similar a data point is to its own cluster compared to the closest neighbor cluster. The silhouette value ranges from −1 to +1.
- The best value is 1, and a value close to 1 means that the sample’s distance to the nearest neighbor cluster is much larger than the intra-cluster distance.
- 0 indicate overlapping clusters[2].
- The worst value is -1, and a value close to -1 means that the sample is assigned to the wrong cluster[2].
- Note that Silhouette Coefficient is only defined if the number of clusters is at least 2 and at most the number of samples minus 1.
The Silhouette score of the model is the average Silhouette value of all samples.
Example
From the example graph, we can see that the model with 2 clusters has the highest value of the Silhouette score, and the model with 3 clusters has the 2nd highest value, so we get the result that there are 2 or 3 clusters.

Method 3: Hierarchical Graph
The hierarchical graph represents the distance between data points in a tree structure. The y-axis is the euclidean distance, so the longer the vertical line is, the larger distance between the clusters.
Example
From the graph, we can see that the two clusters connected by the blue line have the largest distance, and the two sub-clusters in red have a relatively large distance too. Therefore, the hierarchical graph suggests 2 or 3 clusters.

Method 4: AIC and BIC from GMM (Gaussian Mixture Model)
The Gaussian Mixture Model (GMM) AIC and BIC scores can help us decide the optimal number of clusters. Both AIC (Akaike Information Criterion) and BIC (Bayesian Information Criterion) are metrics that measure the relative prediction errors of different models. The lower the value is, the better the model is.
Example
From the example graph, we can see that B I C has the smallest value at 2 clusters, and similar value at 3 clusters. Although the AIC value for 10 clusters is the smallest, the difference between 2 or 3 clusters and 10 clusters is quite small. In this case, we will choose a simpler model with 2 or 3 clusters.

Method 5: Gap Statistics
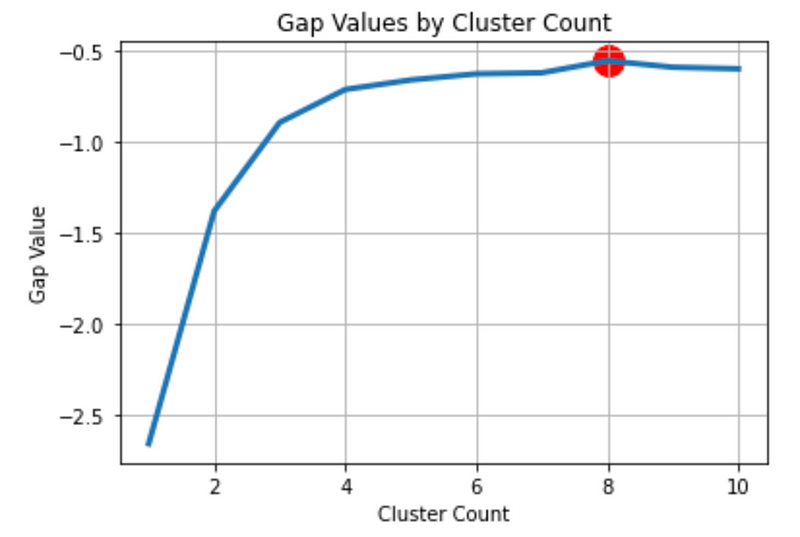
Gap statistics compares the change in within-cluster dispersion with the uniform distribution[3]. A large gap statistics value means that the clustering is very different from the uniform distribution.
Example
Anaconda.org has a notebook with the implementation of gap statistics[1]. From the example graph, we can see that the Gap statistics value generally increases with the number of clusters. The red dot shows that 8 clusters give us the largest gap value, but we can see from the visualization that after 3 clusters, the graph is relatively flat, showing a diminishing gap increase. Therefore, the optimal number of clusters is 3 if we use the elbow method.
Which method to use for the optimal number of clusters?
Now we have learned the 5 different ways of choosing the number of clusters, you might wonder how to choose a method for your project. Here is a general guideline:
- Start with the elbow method for the within-cluster sum of squares and see if there is a clear elbow.
- If the elbow is not very clear, use the hierarchical graph to help decide the optimal number.
- If the optimal number of clusters is still not obvious after using the elbow method and hierarchical graph, use all five methods and choose the optimal number of clusters the majority of methods suggest.
To learn how to write Python code for the five methods, please check out my previous tutorial 5 Ways for Deciding Number of Clusters in a Clustering Model.
More tutorials are available on GrabNGoInfo YouTube Channel and GrabNGoInfo.com.
Recommended Tutorials
- GrabNGoInfo Machine Learning Tutorials Inventory
- 5 Ways for Deciding Number of Clusters in a Clustering Model
- Hierarchical Topic Model for Airbnb Reviews
- 3 Ways for Multiple Time Series Forecasting Using Prophet in Python
- Time Series Anomaly Detection Using Prophet in Python
- Time Series Causal Impact Analysis in Python
- Hyperparameter Tuning For XGBoost
- Four Oversampling And Under-Sampling Methods For Imbalanced Classification Using Python
- Five Ways To Create Tables In Databricks
- Explainable S-Learner Uplift Model Using Python Package CausalML
- One-Class SVM For Anomaly Detection
References
[1] Python implementation of the Gap Statistic


