
ANNUAL FINANCIAL ROUNDUP
How did the financial markets, different sectors & assets perform in 2020?
Visualizing the yearly statistics of Financial markets, Assets & Businesses
An unforgettable 2020 has concluded as we look ahead to a future with optimism. There was no shortage of Coronavirus headlines and the resulting economic shocks last year and the trend is likely to continue in the near future as the fallout from the pandemic continues to unfold. Big government spending and central banks’ unorthodox monetary policy tools flooded the markets with dollars, which have caused historic deficits.
Shocks hit supply chains across the globe and made businesses and governments even more skeptical about their reliance on China. While low-paying jobs in most economies took a massive hit, people higher up in the income ladder switched to remote working — something which might become more commonplace even after the pandemic. Crude Oil prices shockingly went negative at one point as people stayed home under lockdowns, giving impetus to the phase-out of fossil fuels.
After an impulsive collapse in March, U.S stocks posted record gains to end the year — The S&P 500 is up 15.5% for the year and the Dow has advanced 6.6%, while the Nasdaq has soared more than 43%. At the same time, the abundance of dollar supply caused by multiple stimulus packages caused the Greenback-weighted Dollar index to close at lows last seen in Apr. 2018.
The most outstanding ascent was seen in Bitcoin — the premier digital asset and the top crypto. Closing the year at over 300% gains, just shy of $30k, BTC has already hit a new high of well over $34k at the time of writing. Institutional investing took the lead in propelling Bitcoin to new heights, coupled with the inflation fears and general macroeconomic situation of the global economy. Seems like the narrative of Bitcoin acting as the hedge against risk and being a store of value are both gathering strength.
And last, but not least, After four and a half years, two general elections, and plenty of missed deadlines, Britain has finally closed the chapter on Brexit — concluding an agreement with the EU. The U.K. House of Lords gave the green light to Boris Johnson’s post-Brexit trade deal late Wednesday, just 24 hours before the country’s final split from the European Union. On the side, Britain has already conducted free trade deals with 62 countries.
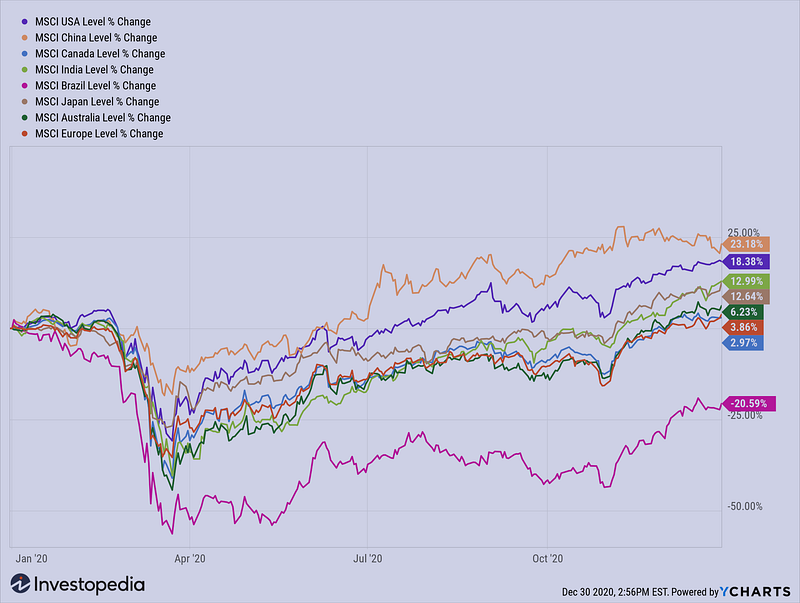
It’s my sincere hope that 2021 brings a message of hope and prosperity for everyone on the globe. It has been a very rough 2020 for many — hopefully, we can make progress this year that is sustainable and across the board. Let’s start off with a look at how some of the major global equity markets performed in 2020 (Figure 1).
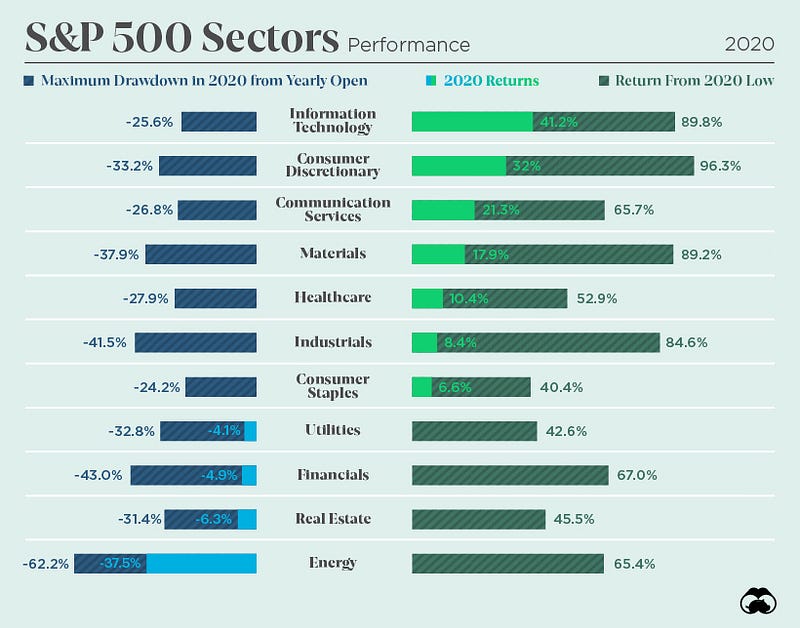
Performance by S&P 500 Sector
While the energy sector was the hardest hard by the pandemic, the services sector has also lagged. But at the same time, the tech stocks have been skyrocketing — with Amazon (76%), Apple (81%), and Netflix (66%) the three best performing FAANG members, other tech stocks like Nvidia (121%), Paypal (115%), and AMD (100%) with their triple-digit returns sailed to new highs (Figure 2).
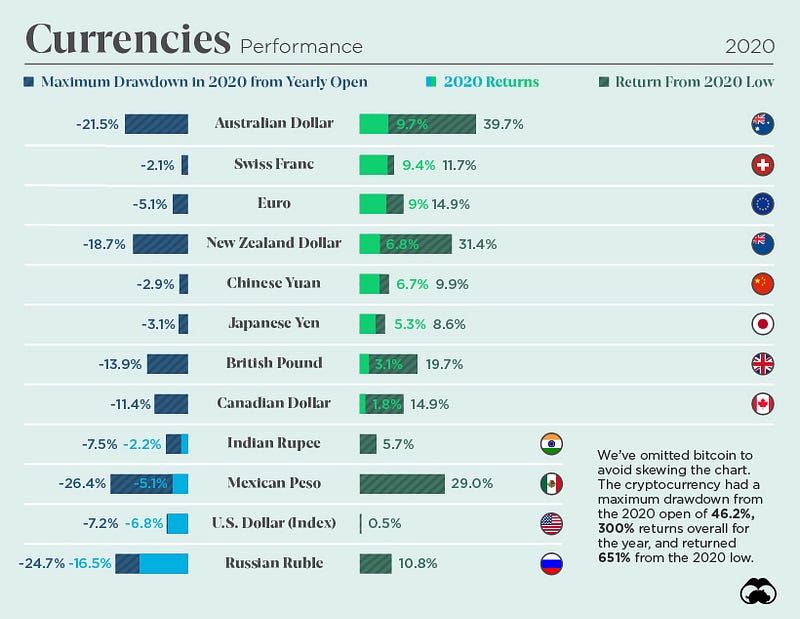
Foreign Exchange Performance in 2020
Although the Greenback gained against its counterparts at the beginning of the year with the flight to safety being the dominant theme in the financial markets with the onset of the pandemic, it has been a different path ever since. All eyes have been on the U.S. dollar’s free-fall downwards since it spiked up in March, especially the inverse correlation that we have between the reserve currency & Bitcoin. Risk currencies like the Australian Dollar have gained significantly from the ultra-easy monetary policies (Figure 3).
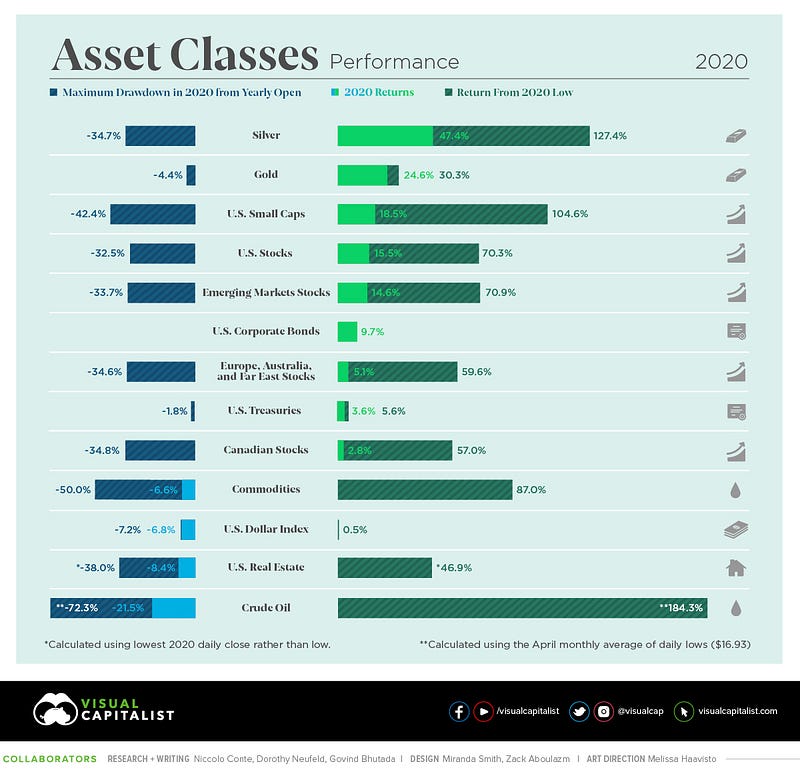
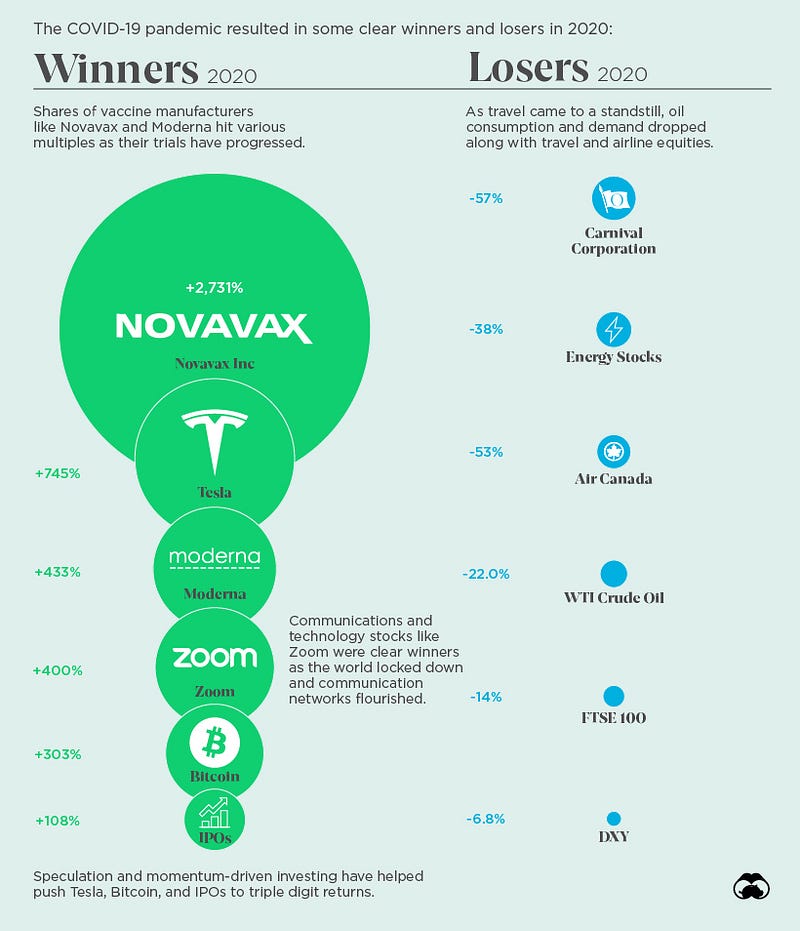
Winners and Losers of 2020
The COVID-19 pandemic & the expansionary monetary policies largely determined the winners and losers. Bitcoin broke well beyond its previous all-time high, returning just over 300% from 2020 open and more than 650% from the lows. Tesla had an even more spectacular run, returning 745% and making Elon Musk the second-richest man in the world (Figure 4).
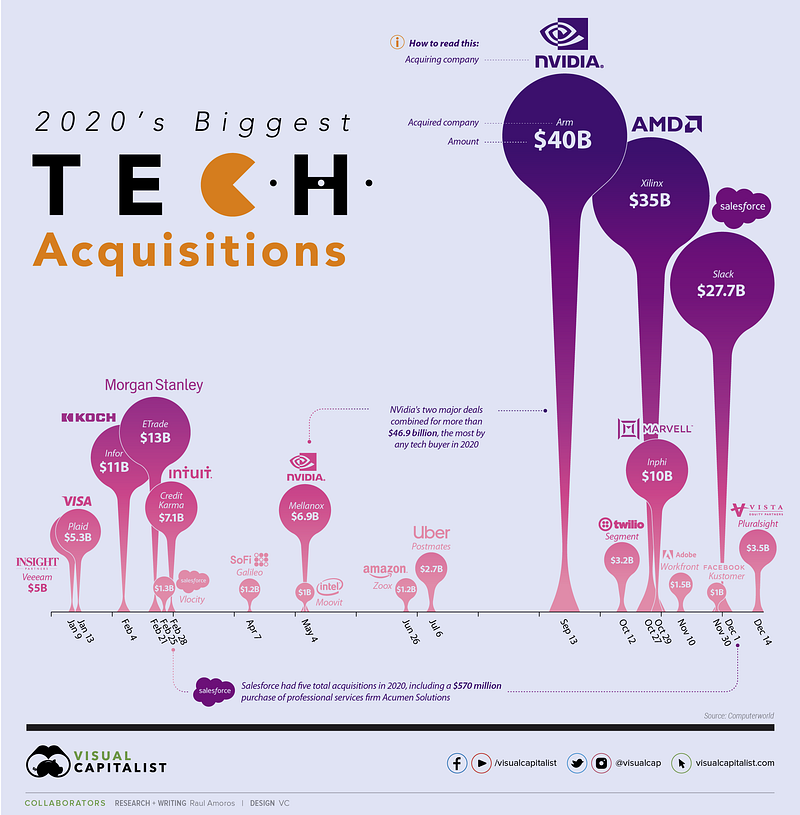
The Biggest Tech Mergers and Acquisitions of 2020
For most businesses around the world, 2020 was a year of difficulties, lost business, and economic hardship. For Big Tech, it was a boon. In the infographic below (Figure 5), we visualize the year’s biggest tech deals above $1 billion using data from Computerworld, which tracked the year’s biggest acquisitions.
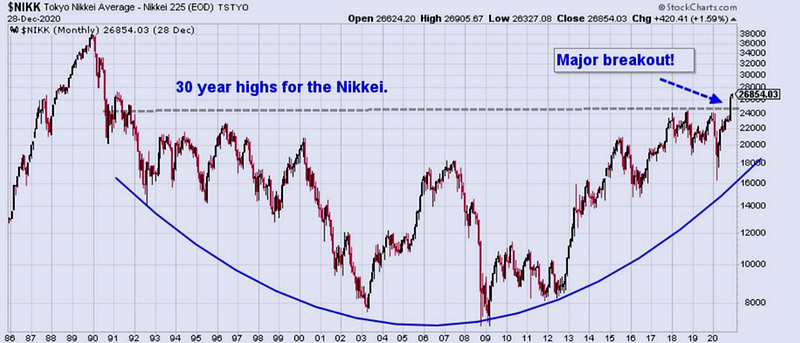
Nikkei's historic Rise
Japan’s stock market traditionally is considered a safe haven for investors’ money, to keep it relatively safe during periods of volatility around the world. That’s not the case anymore. The Nikkei 225 just hit highs not seen in 30 years as investors have flocked back to the island in droves. The last time the Nikkei hit an all-time high was back in Dec. 1989. This was followed by 10 years of economic stagnation that came to be known as the Lost Decade. It’s been rediscovered in a big way as investors bet on its recovery and that of its major trading partners throughout Asia and the Pacific Rim.
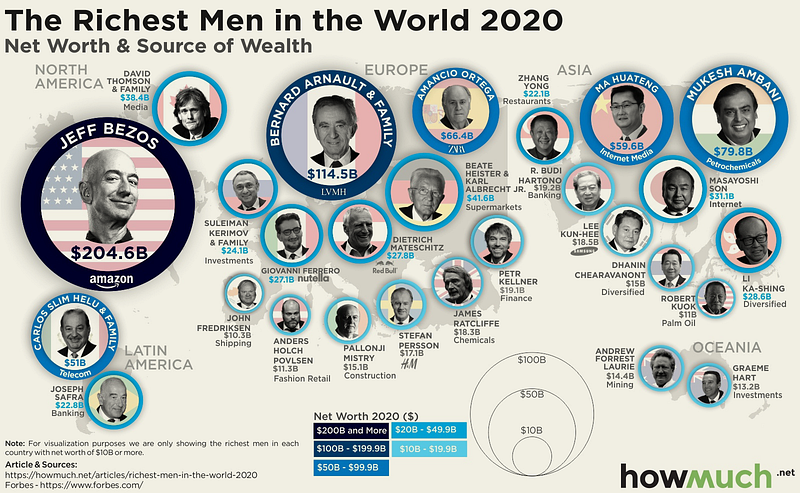
Richest Men in the World in 2020
Jeff Bezos became the first person to ever have a personal net worth of over $200B, making him by far the richest person in the world. Only one other person, Bernard Arnault, controls over $100B. A noticeable observation was that there was no one in the Southern Hemisphere with more than $10B in wealth. Carlos Slim Helu ($51B) and Joseph Safra ($22.8B) are the only exceptions in South America. The data for the infographic (Figure 7) of the richest men was taken from the real-time billionaire tracker from Forbes.
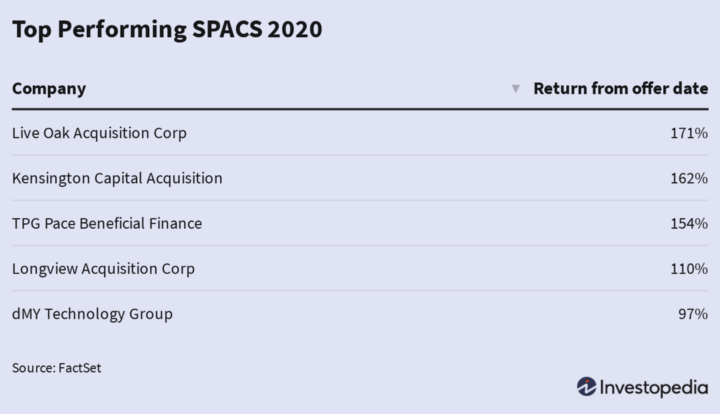
A Very SPAC-tacular Year
Special purpose acquisition companies (SPACs), also known as blank check vehicles, have raised a record $82.1 billion in 2020 as of Dec. 24 — a 6x increase from last year’s record high, according to data from Dealogic. During 2020, these companies have been busy in the cannabis, green technology, and sports-betting arenas, scooping up corporations like DraftKings and Nikola. Following are some of the SPACs with the highest returns following the announcement of their deals (Figure 8).
Previous Edition of GBW
