
WEEKLY BUSINESS ROUNDUP
Global Business Week: The Fintech 2020 Year in Review
The state of Financial markets & Economies, Weekly Charts, Business Trends & Statistics
After progressing for three days straight last week, the U.S equities finally faltered on Friday to closer lower, mainly due to the failure of U.S lawmakers to agree on a new stimulus deal to prop up the economy. The Dow gained 0.4% for the week, while the S&P 500 advanced 1.3% for its fourth positive week in five. The tech-heavy Nasdaq outperformed with a 3.1% gain for the week with a lot of contribution coming from Tesla, which has been on a rip lately.
Despite the quadruple witching, which usually stokes volatility, the market remained relatively stable, and the general optimism about an eventual passing of a new stimulus package along with vaccine deployment remained intact. The latter half of December is usually a hallmark for the Santa clause rally, but who knows we might be in for another surprise which is the only normal in 2020.
Although the Greenback has posted another weekly low, some support needs to be emerging at this oversold level. The current price level below the 90-mark was last seen in Apr. 2018. Having said that, there is no indication of a reversal yet or for that matter, or even a significant correction. Any gains, for now, should be capped below the short term resistance zone of 91.80–92.20.
Cash machines are ringing for Bitcoin investors and the premier digital asset continues to propel higher. At the time of writing, BTC has charted a new high of $24,180 and trending just below that. The long-term resistance of $20k has now become the immediate support for Bitcoin. Big money investors coupled with low liquidity is pushing the crypto kingpin deeper into the unchartered price territory.
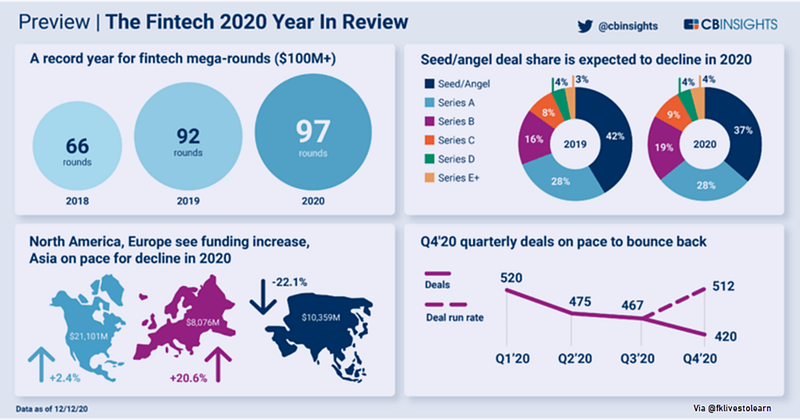
Today’s featured infographic from CB Insights, highlights key investment trends, funding activities, and projections for 2020 (as of 12/12/20) in the Fintech industry. Although deals and dollars could see a decline from 2019 despite deals bouncing back in Q4’20, 2020 YTD has set a record for mega-rounds. 97 mega-rounds YTD in 2020 has surpassed 2019’s total by 5.
Before moving on to some key statistics for the week, here are the weekly & YTD numbers (Figure 1).
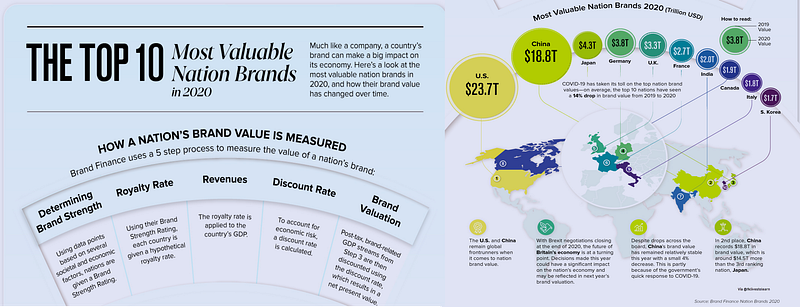
Top 10 Most Valuable Nation Brands in 2020
In today’s heavily interconnected world, a country’s reputation can have a big impact on its overall economic prosperity. A country’s reputation or its brand — is arguably one of its most important assets. A strong nation brand has the power to boost tourism, attract and retain talent, and potentially bring in foreign investment. This infographic below (Figure 2) uses data from Brand Finance’s Nation Brands 2020 report, which attempts to quantify the reputations of different countries around the world.
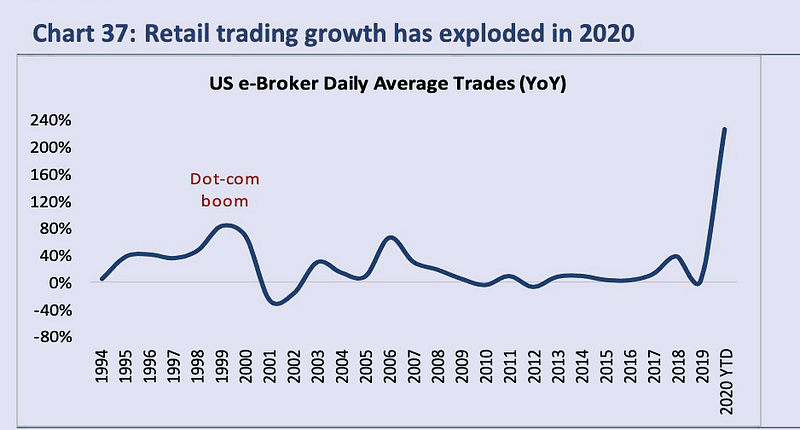
Retail Trading growth has exploded in 2020
According to Bloomberg Intelligence, retail trading comprises 20% of U.S. stock orders and has increased by 5 percentage points in the $42 trillion stock market in just one year (Figure 3). It has smashed through the highs it set during the dot-com boom of the late 1990s. No need to tell you how that ended.
The technology has become better and easier to use — and the markets have never been easier to access via ETFs, fractional shares, and zero-commission trading. But the markets haven’t changed fundamentally — except for the fact that there are fewer public companies than 20 years ago and very smart and increased automation via powerful algorithms that are moving trillions of dollars around the world at the speed of a click.
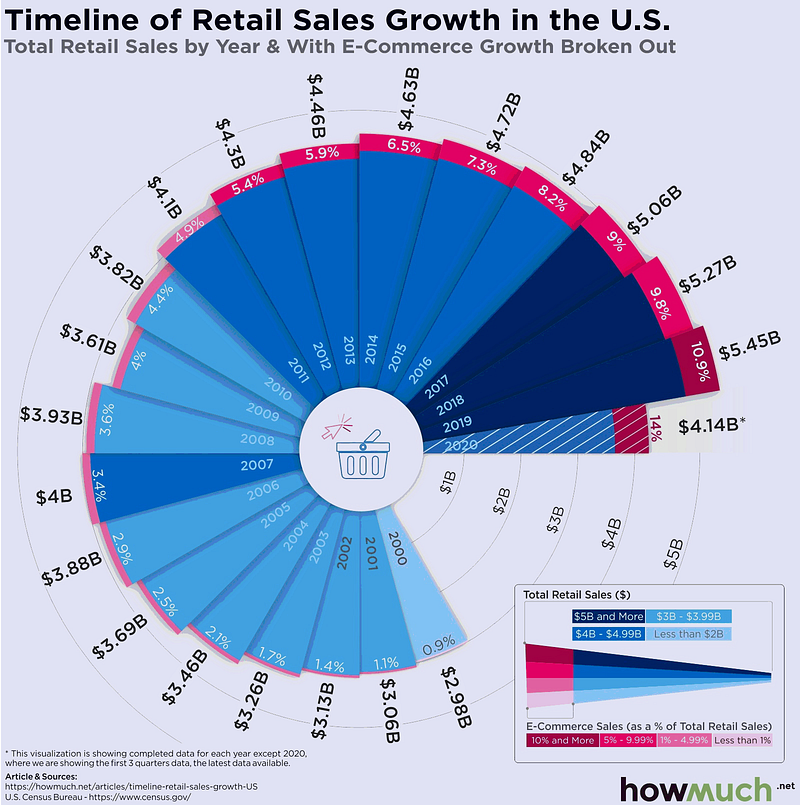
Timeline of e-commerce retail growth in the U.S
According to the data on retail numbers from the US Census Bureau (Figure 4), E-commerce sales have continuously increased every year since 2000 as more and more people become comfortable shopping online. Overall retail sales have also grown during this same time period, increasing from $2.98 billion in 2000 to $5.45 billion in 2019. On top of this, 2020 has already set an all-time record for e-commerce, topping 14% of retail sales.
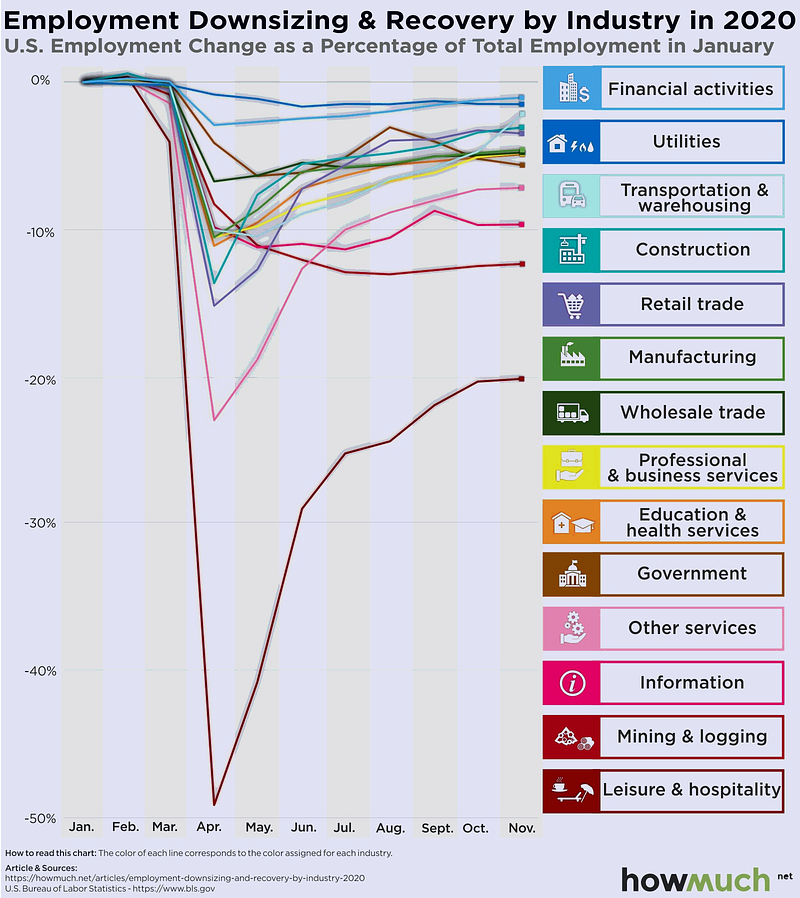
How COVID-19 has changed employment in U.S.
The coronavirus pandemic has changed the industry differently, while it has decimated the leisure and hospitality industry — shedding almost 50% of all jobs in the two months between February and April 2020. And the industry has seen a very slow recovery since. While some industries like financial activities and utilities have only been slightly impacted.
On the other side of the spectrum, the Technology sector has benefitted greatly. The data for the visualization was taken from the U.S. Bureau of Labor Statistics (Figure 5), which tracks employment numbers by the industry on a monthly basis starting from January 2020.
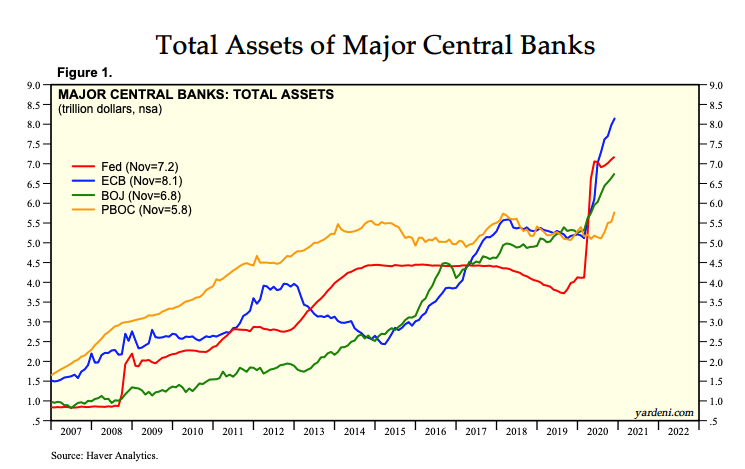
Total Assets of Major Central Banks
Ever since the pandemic started, the global central banks stepped in a big way to help the financial & monetary systems of the respective countries. They have been gobbling up government and corporate bonds all year, and laying the safety net for record-high equity markets. This has given an exponential rise to their balance sheets which can be seen in the chart below (Figure 6).
Previous Edition of GBW
