
WEEKLY BUSINESS ROUNDUP
Global Business Week: Debt-to-GDP ratio continues to rise
The state of Financial markets & Economies, Weekly Charts, Business Trends & Statistics
Even as the week ended in slight losses for the three major U.S indices, the overall market maintains a strongly bullish undertone. The week was marked by investors waiting for signs of stimulus relief and vaccine news. December is usually one of the best months for stocks and most of these gains come in the shape of ‘Santa Claus rally’, which kicks in the second half of the month. With so many anomalies this year, it would be interesting to see if the Equities can keep up with this tradition.
There was a lot of buzz around the launch of high-profile IPOs like Airbnb & DoorDash. Both of them posted some explosive gains and more importantly, held onto the lion’s share as investors warmed to new and shiny things. Another thing that has been noticeable since mid-November has been the poring of money into Bitcoin and Equities and getting out of Gold. Investors are obviously getting attracted to riskier assets.
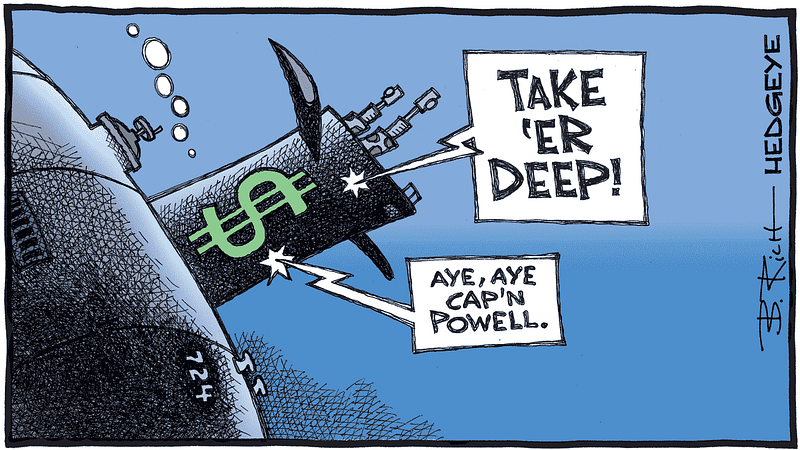
Money has also been pulling out of the reserve currency at an accelerated pace. Greenback has seen an extended downturn ever since mid-March, ever since the pandemic-driven monetary stimulus kicked in to support the markets and the global financial system. The dollar index has consolidated in a tight range last week, after charting a new low of 90.48.
And finally the most-watched assets these days are the Cryptos, led by Bitcoin. After posting an all-time high, Bitcoin has been going under some bearish consolidation — which is perfectly normal for an asset, which has just reached an ATH. Although BTC fell to as low as $17,552, it is rebounding as we speak with the price currently sitting at $18,763. Technically, it seems like BTC is making a higher low before it continues with its medium-term bullish trend.
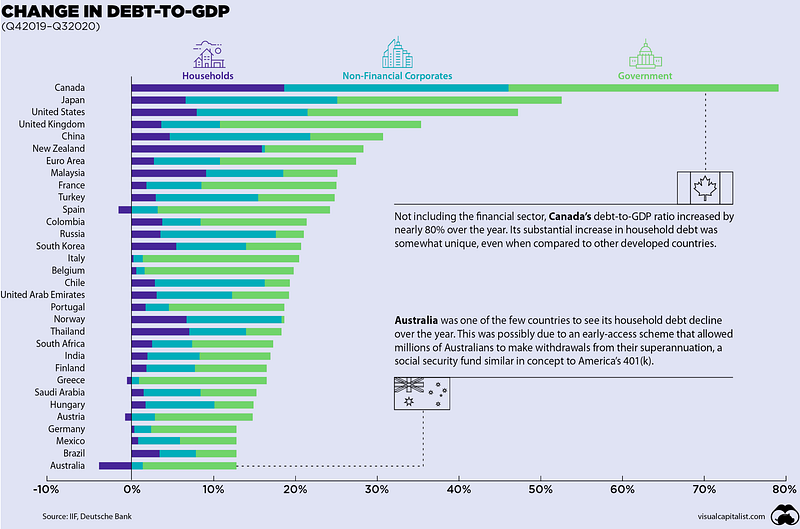
Although we are seeing the light at the end of the tunnel as the COVID-19 vaccine rollout, the economic situation is unlikely to improve anytime soon. Falling revenues combined with costly pandemic relief measures have increased global debt by $20 trillion since the third quarter of 2019. By the end of 2020, economists expect global debt to reach $277 trillion, or 365% of world GDP. Today’s highlighted infographic (above) uses data from the Institute of International Finance (IIF) to provide an overview of where debt, relative to GDP, has increased the most.
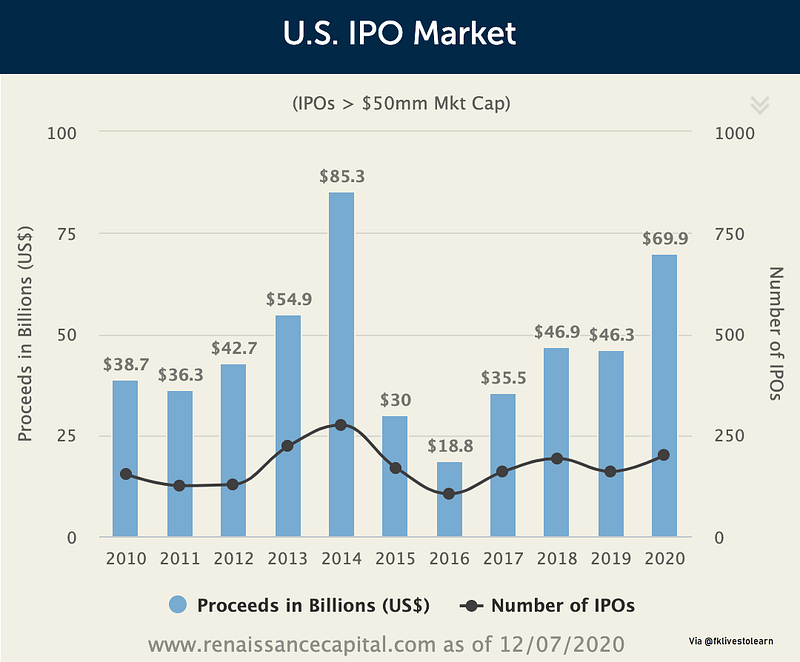
Red Hot IPO market
Talking about the red hot IPO market — According to Crunchbase, unicorns, or private startups with +$1 billion valuations, that have made “exits” via IPOs through October this year saw a 117% increase (Figure 2) between the last known valuation and their valuation upon going public — the highest jump in a five-year timeframe. The second-largest year is 2018 when we saw a 58% growth.
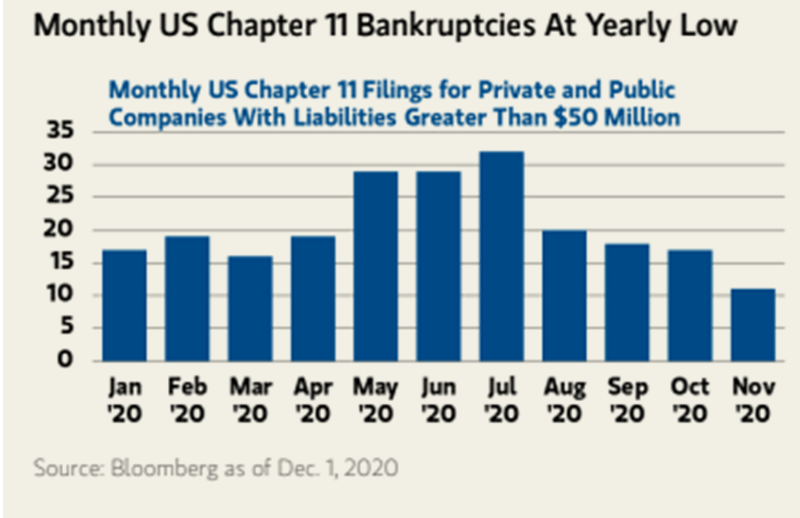
U.S bankruptcies have subsided
U.S. bankruptcies are at a yearly low after spiking in July. Chalk it up to resilient business owners, low-interest rates that have allowed for a flood of refinancing, and continued spending by consumers (Figure 3). Who knows how long many of these businesses can hold on, but this is a most welcome trend.
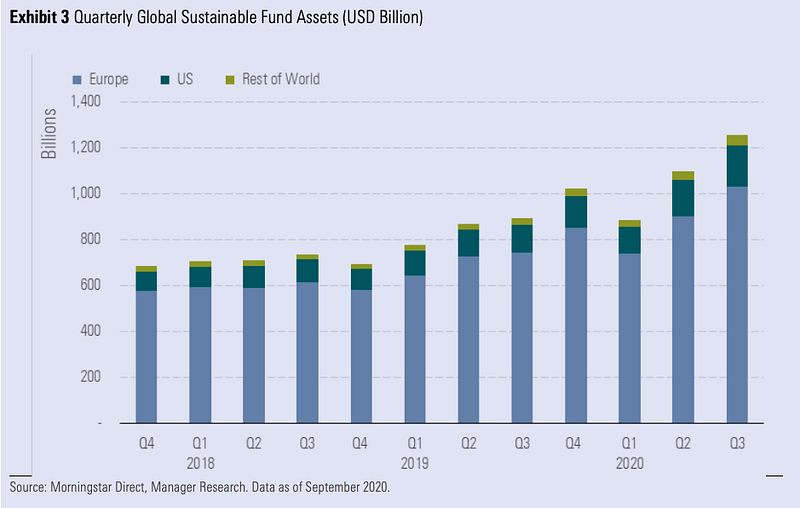
Rapid Growth of ESG Funds
Assets in ESG funds and ETFs have been growing pretty steadily for the past few years and especially this year. Younger investors like it and the collapse of the oil and energy industry this year has shifted a lot of assets right up the green alley (Figure 4).
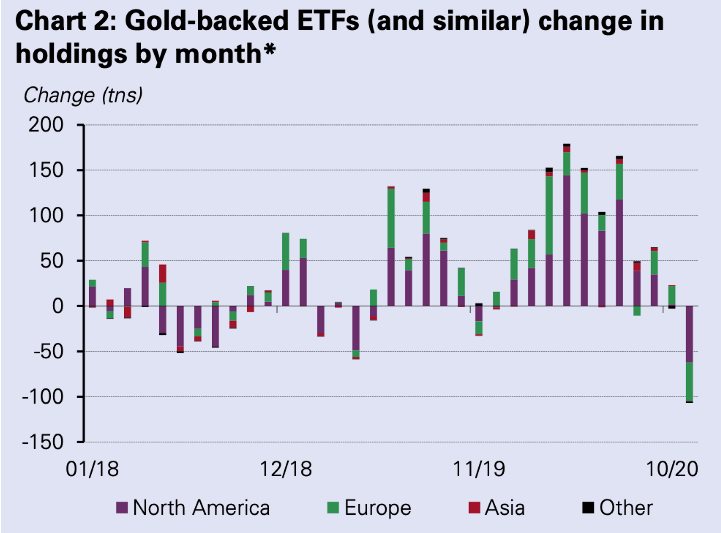
A massive drop in Gold ETF holdings
The net amount of gold ETF holdings decreased by 107 tonnes or $6.8 billion last month as prices plunged the most since November 2016 (Figure 5). This represented 2.87% of assets under management (AUM) and marks the first net outflows in a year and the second-largest monthly outflows ever after April 2013, according to the latest report from the World Gold Council.
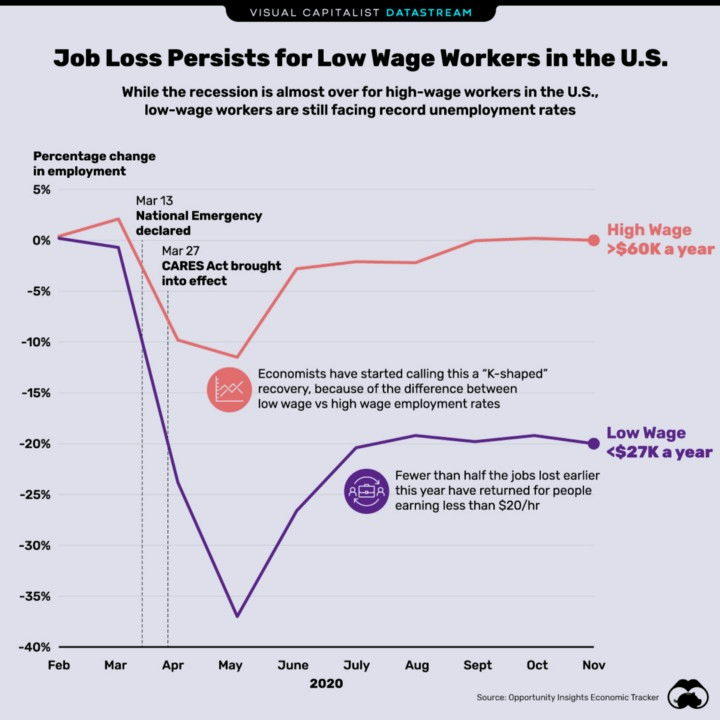
Low-wage workers hardest hit in the U.S
Employment rates for high wage workers have bounced back from their spring slump, but unfortunately, the recovery hasn’t been as pronounced for low-income workers. Less than half the jobs lost earlier this year have returned for those making under $20 per hour. To give you a broader perspective, here’s a look at the percent change of employment rates from February through to November 2020 (Figure 6).
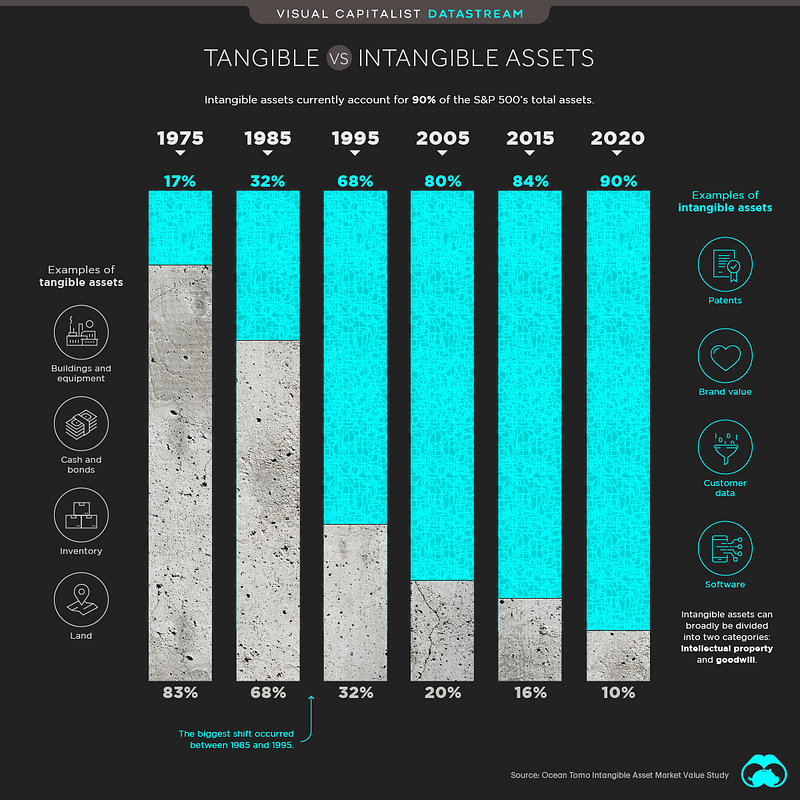
The Soaring Value of Intangible Assets in the S&P 500
Intangible assets currently account for 90% of the index’s total assets (Figure 7). Not only is this a historical high — it’s a nod to just how prevalent technology has become in our lives. Intangible assets are holdings that don’t carry any physical or financial embodiment. This includes R&D, intellectual property, and computerized information such as data and software. While they’re often difficult to value due to certain accounting practices, today, intangibles are worth over $21 trillion.
Market Humor: Greenback remains under Pressure
Previous Edition of GBW
