
Google aims at Excel with new Big Data Features
How to work with more Data Rows in Google Data Studio

Not long ago, I wrote about how Google attacks Power BI with new features in their Self Service BI tool Data Studio — you can find it here. It was one of my most clicked articles, so it seems to be an interesting topic among many data enthusiasts.
After that, Google has updated Data Studio during the last months, especially with new other connectors. Also, another great news was that Data Studio can now display up to 100 dimensions and metrics, before that it was significantly less. This makes Data Studio much more powerful for me. Find the news here.
Also it was from now on possible to scroll horizontal. Thus, even large data sets can now be displayed in Data Studio. This could ensure that companies can map even more legacy reporting tools in Data Studio.
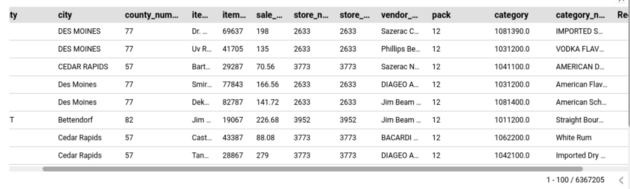
And now to the actually “Big News”: You can now display up to 50,000 rows in tables in your reports. Previously, tables could display a maximum of 5,000 rows [1].
In my career, this was in fact often an argument against Google Data Studio and often one heard from colleagues in areas such as internal audit, controlling or finance that this was quite weak, that only so little data could be displayed at once. You have to know that people from these areas usually work with huge Excel spreadsheets. And in my eyes, Excel is often a reason why digitalization offensives or self-service BI tools have not quite reached the Excel nerds in Controlling (no offense intended — there are also good reasons).
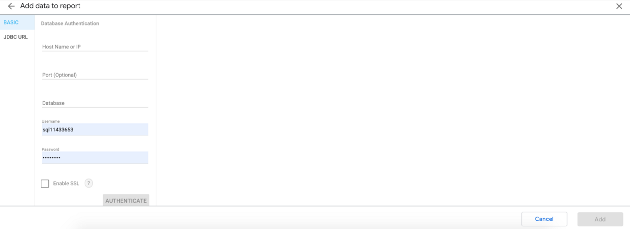
But now with the new capabilities to display more data (more rows and columns), the many new connectors and some other important features, such as the possibility of more joins to data sources, Data Studio can be a relatively good alternative to more popular BI tools such as MS Power BI, Qlik or even Excel, in my opinion.
CIOs, CDOs and CISOs will be equally happy, because now costs could be saved, because the product range and the associated administration is reduced. Companies can replace existing reporting solutions and tools with a Google Stack, which often improves interfaces and data quality. Also, data may no longer have to be transferred to other platforms, which means fewer points of attack. In addition, old dashboards and reporting solutions that were not considered replaceable and were still created in Excel can now be realized with Data Studio.
Sources and Further Readings
[1] Google, Release Notes (2022)
[2] ConceptDraw, Design Elements — Big Data (2022)


