
WEEKLY BUSINESS ROUNDUP
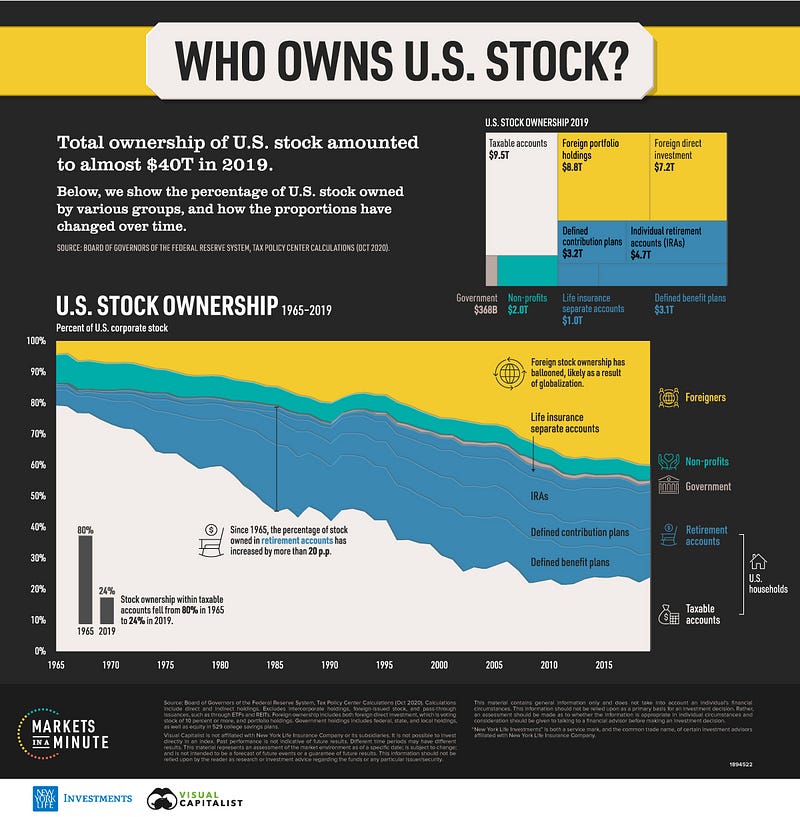
Global Business Week: Visualizing U.S. Stock Ownership from 1965–2019
The state of Financial markets & Economies, Weekly Charts, Business Trends & Statistics
Tech sector was back in favor on the U.S markets for the holiday-shortened week. The Nasdaq, which trailed the major averages in Q1, gained 2.6% for the week, topping the S&P’s gain of 1.4% and the Dow’s 0.2%. Tesla was the big winner in mega-caps and Treasury yields continued strong moves, making a run above 1.75% on Tuesday and cementing above 1.7% on Friday. U.S jobs report blew past the estimates reporting 916k new jobs for the month of March with the unemployment dropping 0.2 percentage points to 6%. The strength of the economic recovery is evident from these numbers.
April opened with a new market achievement — the S&P 500 broke the 4,000- barrier, crossing the threshold in the first few minutes of trading before ending the session at 4,019, up more than 1%. It took just 434 trading days for the benchmark index to go from 3,000 to 4,000, by far the shortest time frame for a 1,000-point move in its history, according to Dow Jones Market Data. Investors are now looking forward to the $2 trillion+ infrastructure spending plan announced by the U.S President.
Greenback continued its winning ways, especially against the dollar index benchmark-heavy EURUSD down sharply on bleak regional outlook and third wave fears. DXY continues to benefit from a strong U.S economic recovery. A strong labor market performance in the month of March was a testament to this narrative. DXY managed to close above the 93.00 level — remaining in the short-term daily bullish channel with a firm undertone.
Cryptoverse consolidated for the most part as we began to see the first signs of the resurgence from the Alt. coins. While Bitcoin had a hard time penetrating the $60k level, resounding gains in Ethereum led the second-largest crypto to chart a new all-time high (ATH), close to $2150 — hovering around $2078, at the time of writing. BTC dominance, which has stayed at about the 60% for a while, is beginning to slip — indicating an early sign towards the start of the Alt. coin season.
Today’s featured infographic (above) came from Visual Capitalist, with the data coming from New York Life Investments. It features the ownership of stocks on the U.S. stock market — the largest in the world, with total U.S. stock ownership amounting to almost $40 trillion in 2019. Foreigners own the most U.S. stock. Their portion of ownership has grown rapidly from about 5% in 1965 to 40% in 2019.
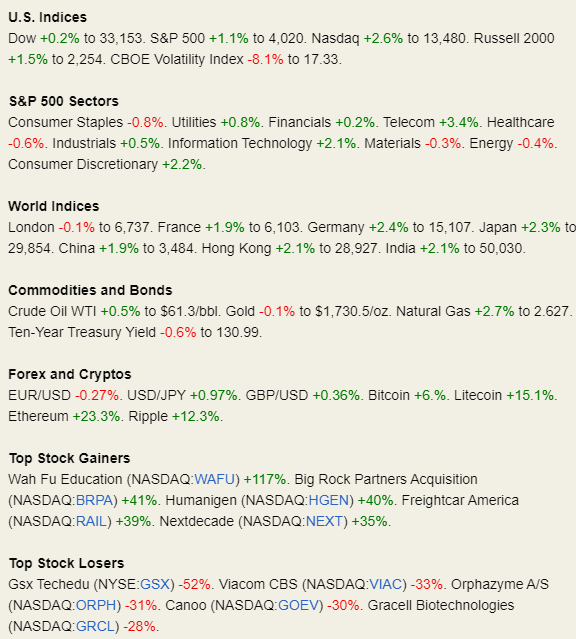
And as usual, here are some weekly numbers (Figure 1) from financial markets & different asset classes, before we move on to some of the other statistics.
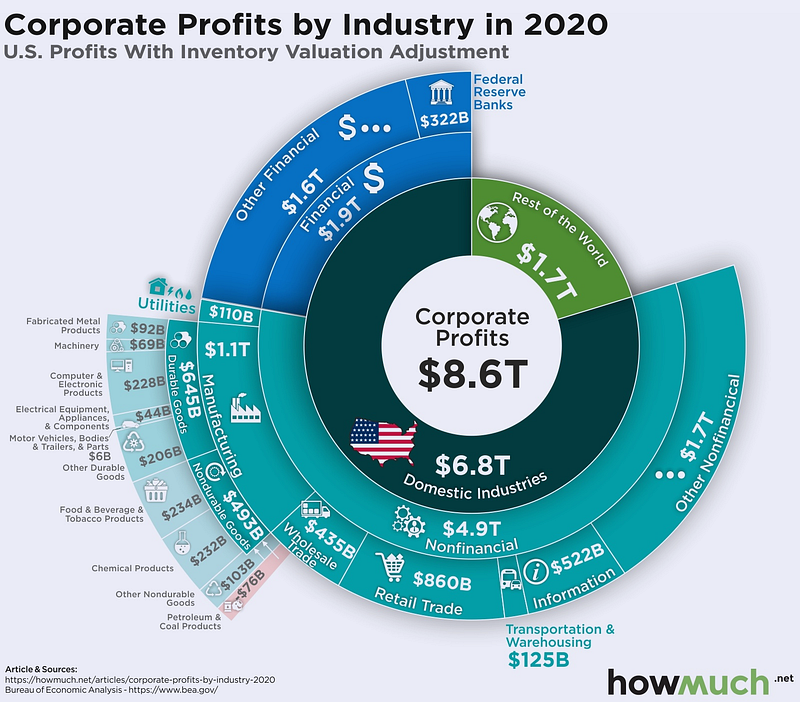
U.S Corporate Profits in 2020
This visualization from Howmuch.net took the data from researchers at the U.S. Bureau of Economic Analysis (BEA). U.S. corporate profits were split between domestic and international markets. The detailed infographic (Figure 2) contains both high-level information about the source of U.S. corporate profits, and detailed stats on the specific industries and sectors earning the most money. U.S. corporations generate most of their profits in domestic industries ($6.8 trillion ), while the financial sector generates more net income than every other U.S. company in international markets ($1.9T vs. $1.7T).
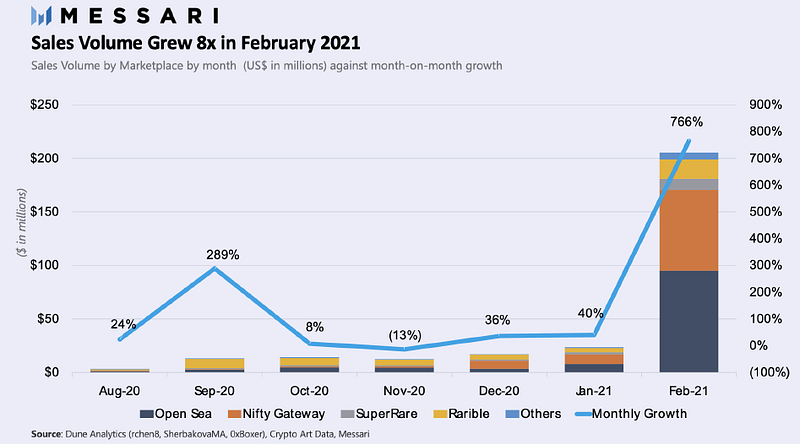
NFTs Surge to new Highs in 2021
Traded since around 2017, Non-Fungible Tokens (NFTs) have surged to new heights in 2021. According to NonFungible.com, total NFT trading volumes on the Ethereum blockchain amount to over $500 million, nearly half of which were in the past month alone. Total NFT sales from the marketplaces shown in the graph provided by Messari Research have grown exponentially in the month of February — a 766% increase month-over-month (Figure 3).
Visualizing the Richest Families in America
The infographic below (Figure 4) maps America’s 50 richest families which hold a collective wealth of $1.2 trillion. This ranking goes beyond nuclear family units and self-made fortunes, and it instead measures the wealth of multi-generational or extended families. The visualization, which leverages the latest data from Forbes, reveals the wealthiest families in America and the enterprises that helped them earn their billions.

Regional Global Wealth (1820–2018)
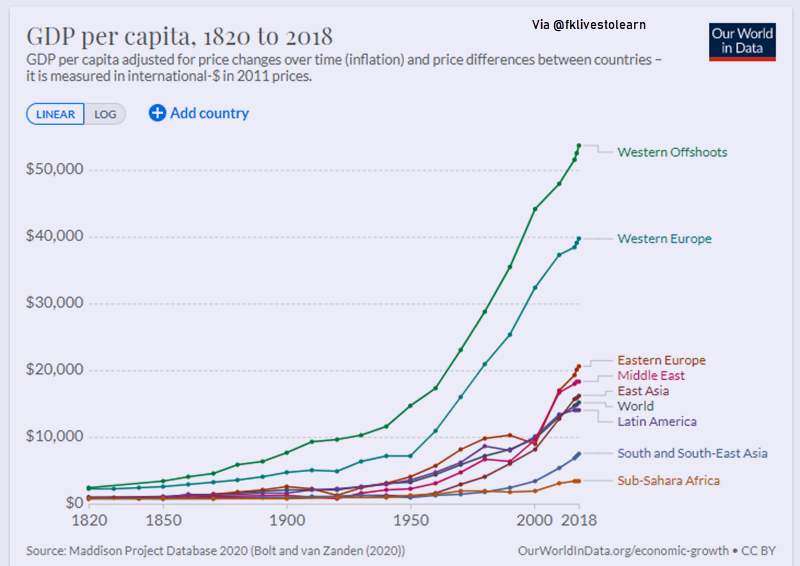
Staying on the topic of wealth, the chart below (Figure 5) from Our World in Data maps the growth of different regions in terms of GDP per capita over the last two centuries. Generally speaking, regions began to see growth post the WW II, but the biggest growth in wealth came in the last two decades. Regionally speaking, the Western hemisphere leads the other regions by a large margin. Sub-Saharan Africa is the only region where wealth growth has flattened, whereas South & Southeast Asia have seen the smallest increase.
Trade Union Comparison
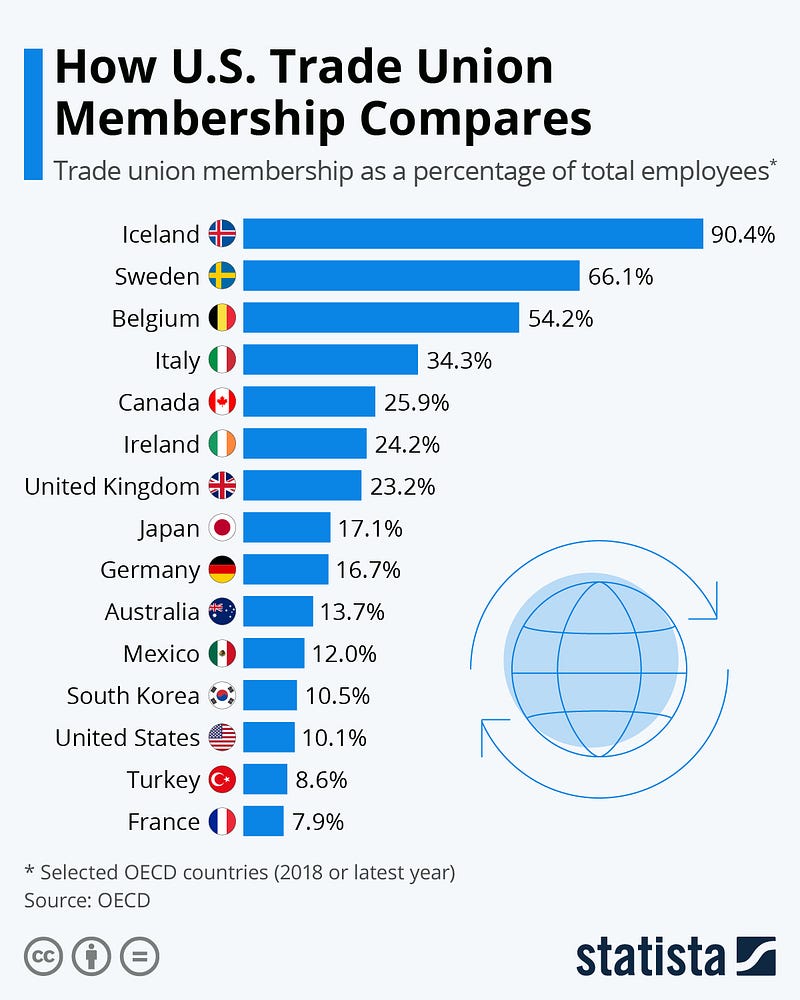
Amazon warehouse workers in Bessemer, Alabama (U.S) are pushing to form a union and their votes are set to be counted after one of the most high-profile and consequential unionization drives in recent U.S. history. Their employer remains bitterly opposed to the move which could result in Amazon’s first union within the United States. If the vote is successful, Amazon would have to enter formal negotiations with the Retail Wholesale and Department Store Union regarding a contract for the 6,000 staff members working at the facility. With that in mind, let’s look at the trade union membership as a percentage of total employees around the World (Figure 6).
Tech Giants AI acquisition in 2020
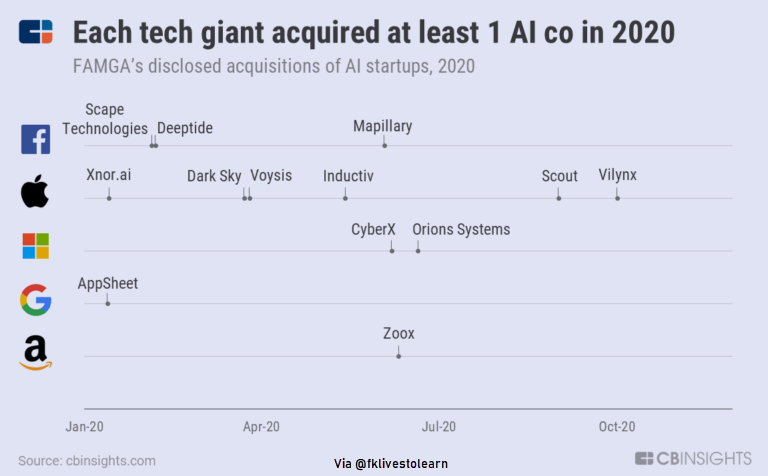
According to CB Insights, in 2020, Facebook, Apple, Microsoft, Google, and Amazon collectively acquired over a dozen artificial intelligence startups to enhance existing products and enter new markets. We look at where the tech giants are making moves in AI. In 2020, Facebook, Apple, Microsoft, Google, and Amazon (FAMGA) acquired a total of 13 artificial intelligence startups — with each tech giant acquiring at least one startup (Figure 7). Historically, many of FAMGA’s prominent products and services have come out of acquisitions of AI companies — such as Apple’s FaceID or Google’s contributions to healthcare through DeepMind.
Big Tech Just Keeps Getting Bigger
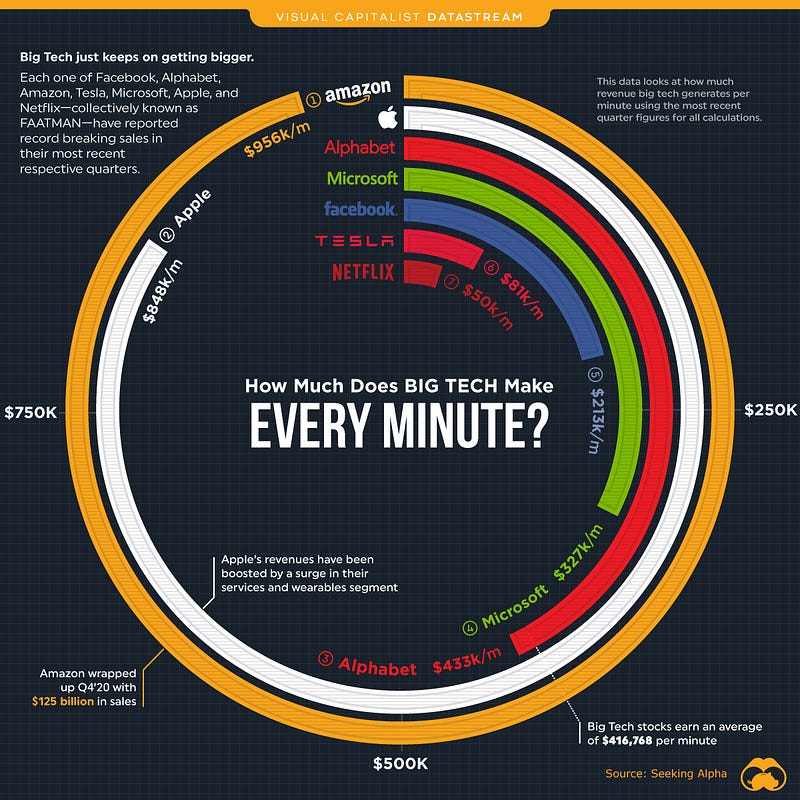
Staying on the topic of Big tech, It’s becoming increasingly difficult to wrap your head around just how massive some big tech stocks are getting, especially since they keep outdoing themselves. The pandemic has pushed even more activity online, and the ‘FAATMAN’ stocks (Facebook, Amazon, Apple, Tesla, Microsoft, Alphabet, and Netflix) have benefited immensely. With many of these companies experiencing record-breaking quarters, how much revenue do the big tech stocks generate per minute? Well, the following infographic answers that question (Figure 8).
Market Humor: Global Recovery Survived a Crisis

Previous Edition of GBW


