
WEEKLY BUSINESS ROUNDUP
Global Business Week: Large tech companies lending is booming globally
The state of Financial markets & Economies, Weekly Charts, Business Trends & Statistics
U.S stocks finished the week with a surge on Friday, as the recovery rally gathered steam with a further ramp in the inoculations across the country. Gains were broad-based, with 10 of the 11 S&P sectors closing higher, led by energy as crude oil futures jumped nearly 4%. For the week, the Dow and S&P 500 rose 1.4% and 1.6%, respectively, but the Nasdaq slipped 0.6%. Treasury yields drifted lower on the week but popped on Friday, with the 10-year adding 6 basis points to 1.67%.
Another notable reversal this year is shaping up in the benchmark Dollar Index (DXY), which seems to be undeterred by the ultra dovish stance by the Federal Reserve. Fresh economic data prints are keeping the Greenback afloat as employment is expected to increase for the third consecutive month. DXY currently stands above the 200-Day SMA of 92.56, for the first time since May 2020 as longer-dated US Treasury yields hold above pre-pandemic levels. Pushing above a critical technical resistance barrier might be an early signal to a medium-term reversal in DXY.
The narrative about cryptocurrencies gaining mainstream adoption is strengthening every day, and while there might still be skeptics out there, investors really are worried about all the worldwide central bank intervention that has been creating undeniable economic influence over the past decade. It’s not just the retail traders driving the game anymore, big-money investors have taken a full-on dive into the digital assets arena. Bitcoin has rebounded 10% after dropping as much to the key $50k level earlier. It’s a trillion-dollar industry and it’s hard to write it off with FUD alone.
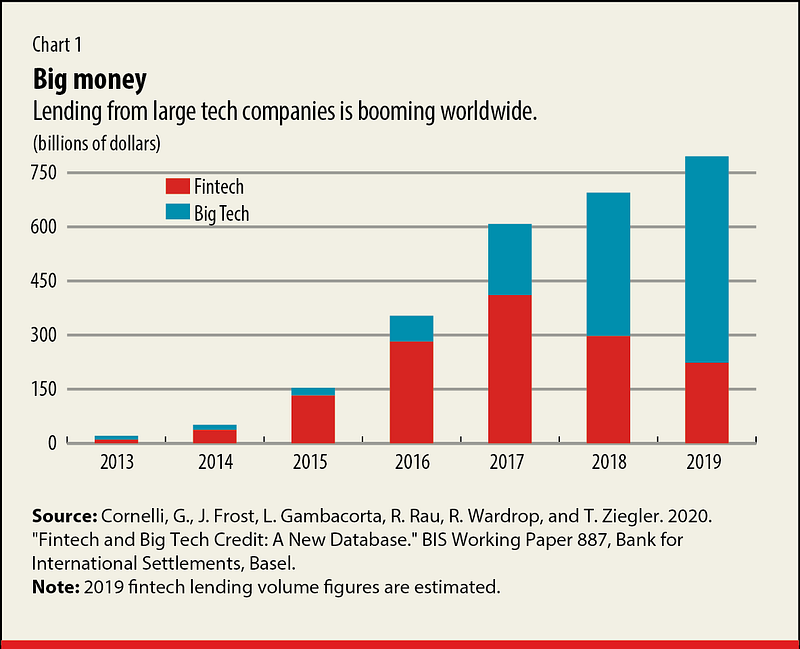
Today’s featured chart (above) highlights that Big Tech credit has boomed worldwide in the past decade, rising to an estimated $572 billion in 2019. Such lending is particularly important in China, Kenya, and Indonesia, compared with traditional credit markets. It is also growing rapidly elsewhere and may even have ticked up during the pandemic as some Big Techs helped distribute government lending to companies.
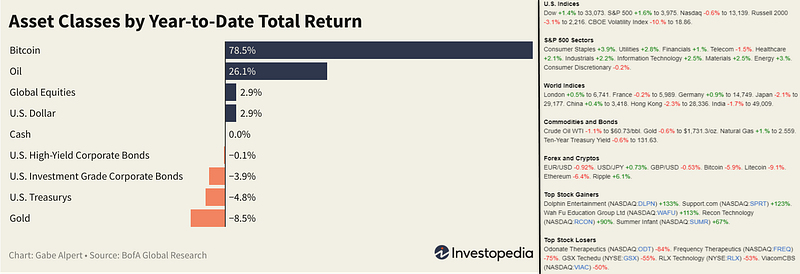
And as usual, here are the weekly numbers of different financial markets and assets (Figure 1).
Comparisons of Tax Revenues Globally
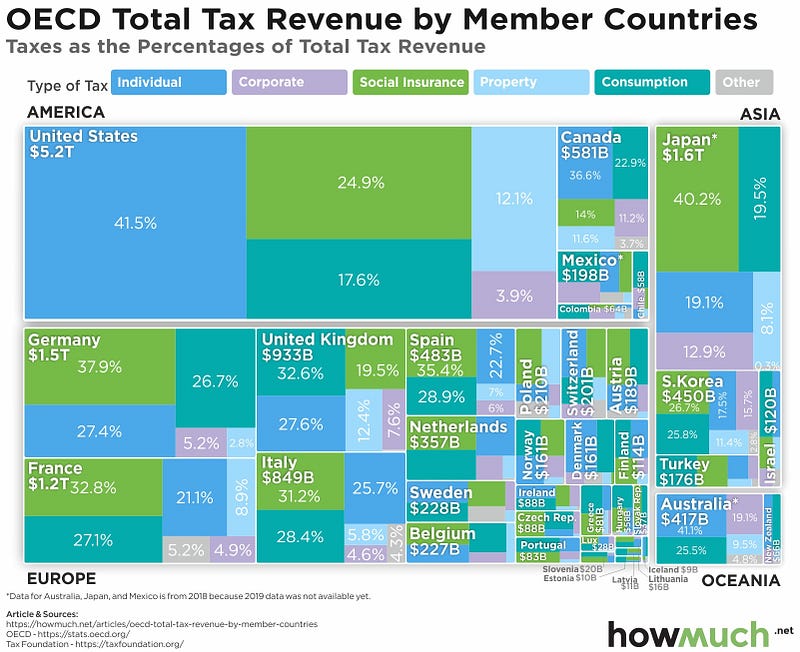
The data for the infographic (Figure 2) by Howmuch.net was taken from the OECD & The Tax Foundation. The figures estimate that the U.S. tax system generates the most money in the world ($5.2T), and individuals shoulder a disproportionate burden of that total (41.5%) compared to other OECD countries. However, businesses pay far less in taxes in the U.S. (3.9%) compared to other countries, like Japan (12.9%) or Australia (19.1%). Consumption taxes, like the Value-added Tax (VAT), make up a third of total tax revenue for OECD countries, but this is usually passed to consumers through higher prices.
U.S Jobless Claims drop to Pandemic Low
According to the Department of Labor, initial jobless claims dropped to 684,000 in the week ended March 20 (Figure 3), marking the lowest level since the onset of the pandemic a year ago & signaling the onset of economic recovery. For the past few months, the number of weekly claims had hovered around 800,000, never coming close to returning to pre-pandemic levels. As more states around the country ease restrictions, jobless claims are expected to cease further.

The Rise of Women on Boards of Directors
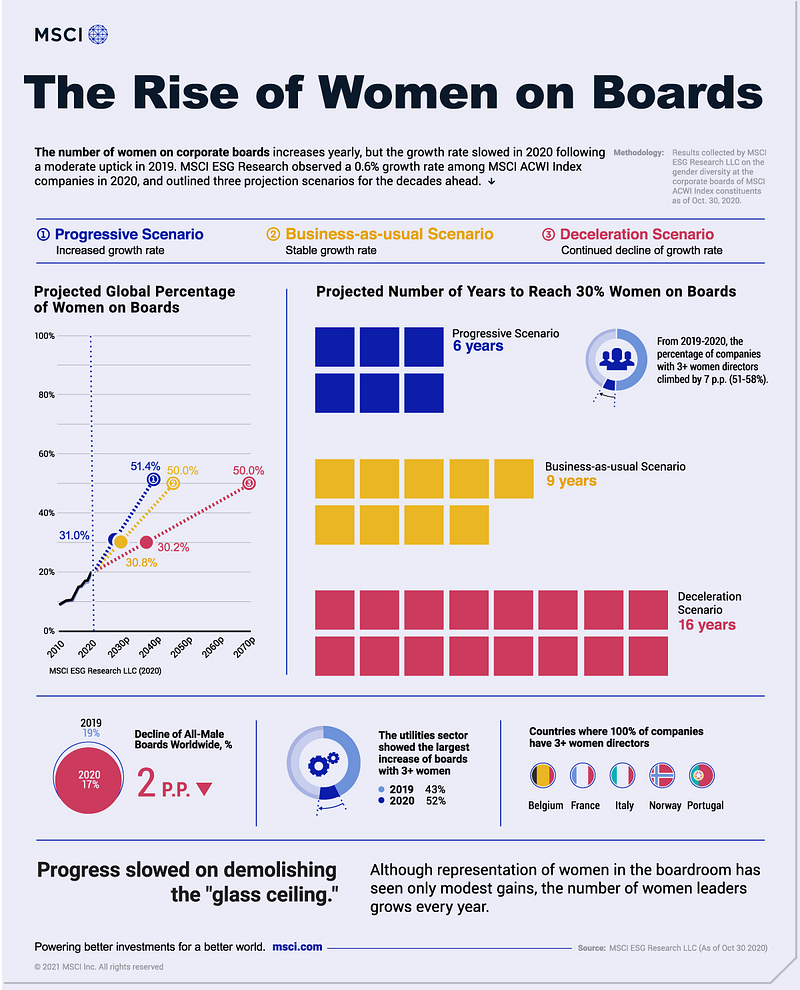
Based on MSCI research of All Country World Index (ACWI) constituent companies, the infographic below (Figure 4) reveals a 10-year trend of women’s representation on corporate boards and projects three future scenarios on the way to parity. Although the number of women on boards is rising across the globe — but the rate of increase has slowed for three of the past four years.
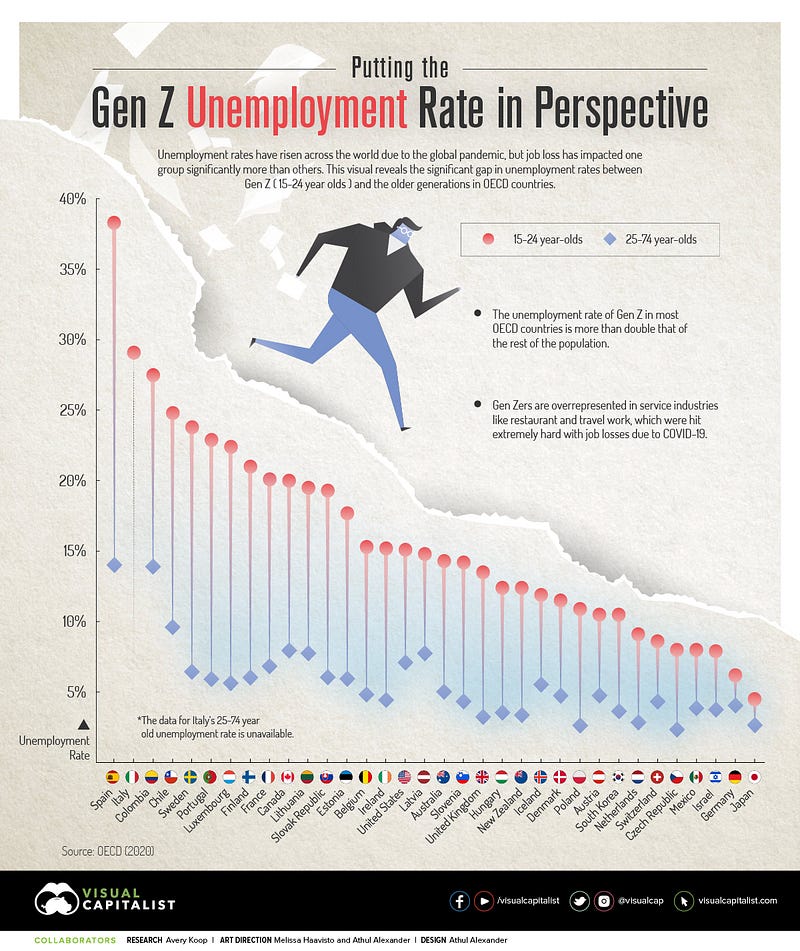
Gen Z Unemployment Rate in Perspective
This infographic (Figure 5), using data from the OECD, displays the difference between the unemployment rate for Gen Zers and the rate for older generations. There are more than 2 billion people in the Generation Z age range globally. These individuals, born between 1997 and 2009, represent about 30% of the total global population — and it’s predicted that by 2025, Gen Z will make up about 27% of the workforce. Due to the global pandemic, Gen Z has been hit the hardest.
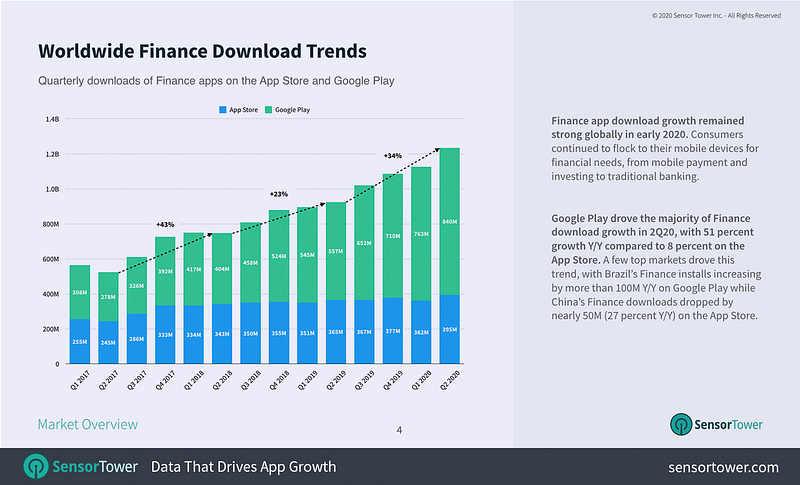
Global Finance Downloads Trends
With the onset of the pandemic and people relying on technology more than ever before, finance app download growth remained strong in 2020 (Figure 6). Consumers continue to use their smartphones to conduct financial transactions — mobile payments, investing & banking, etc.
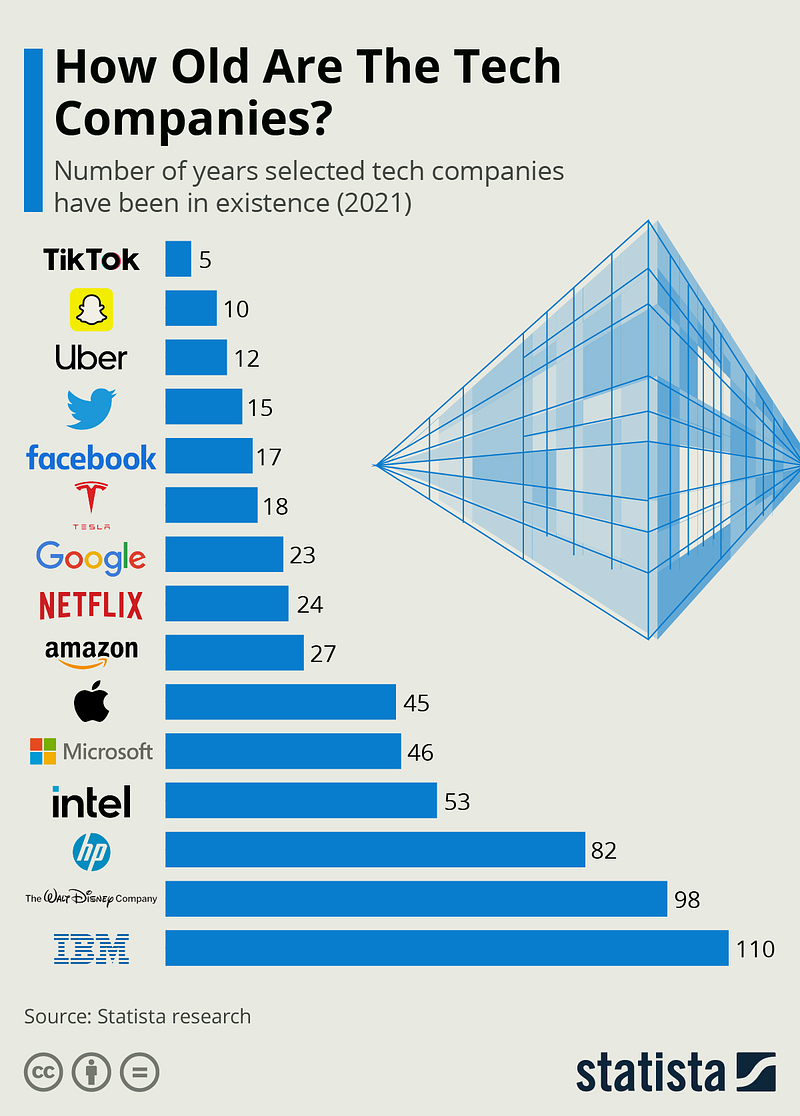
How Old are the Tech Companies?
March 21st marked 15 years of Twitter’s existence. Despite the anniversary, Twitter is still generally regarded as one of the new tech kids on the block, and many other technology companies have been operating for a whole lot longer. Take IBM for example. It has been around since 1911, an impressive 110 years in business (Figure 7). It may seem hard to believe but Intel has also been around for more than half a century while Microsoft and Apple are both more than four decades old.
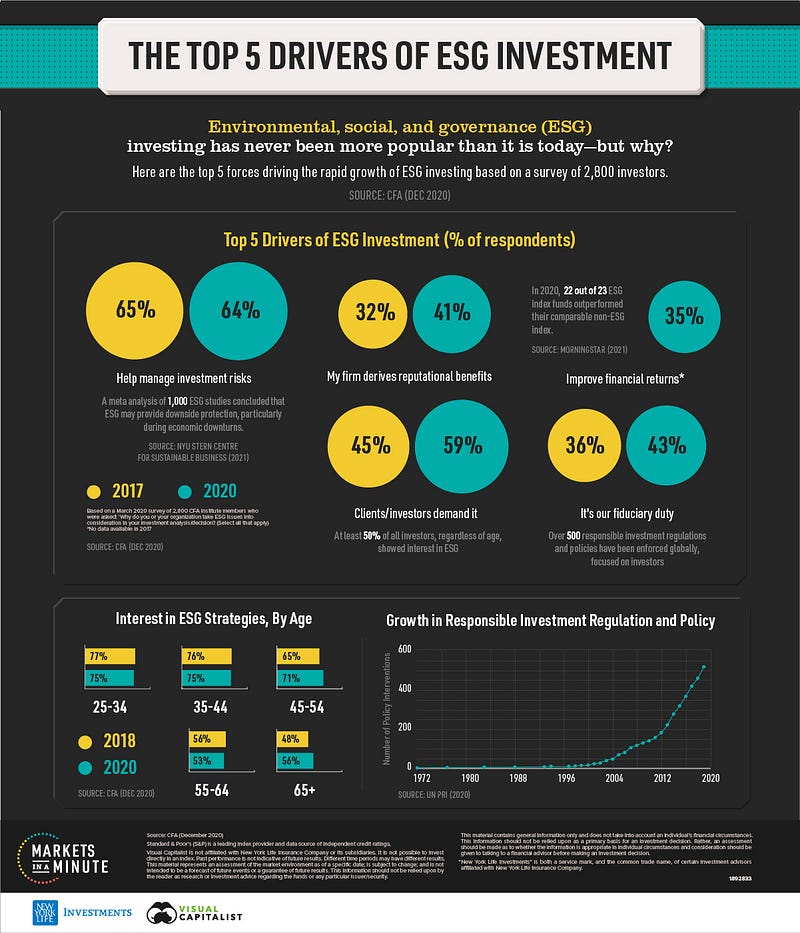
The Top Five Drivers in ESG Investing
According to Google Trends, environmental, social & governance (ESG) investing has surpassed record levels seen in 2020. By 2025, ESG investing is projected to reach $53 trillion in assets globally — roughly equal to a third of all investment assets under management. To answer the question: why are people choosing to use an ESG strategy? Markets in a Minute chart (Figure 8) from New York Life Investments looks at the top drivers behind ESG investing, based on a survey of 2,800 Chartered Financial Analyst (CFA) investment professionals.
Market Humor: Fed fuelling All-Time Highs

Previous Edition of GBW
