
WEEKLY BUSINESS ROUNDUP
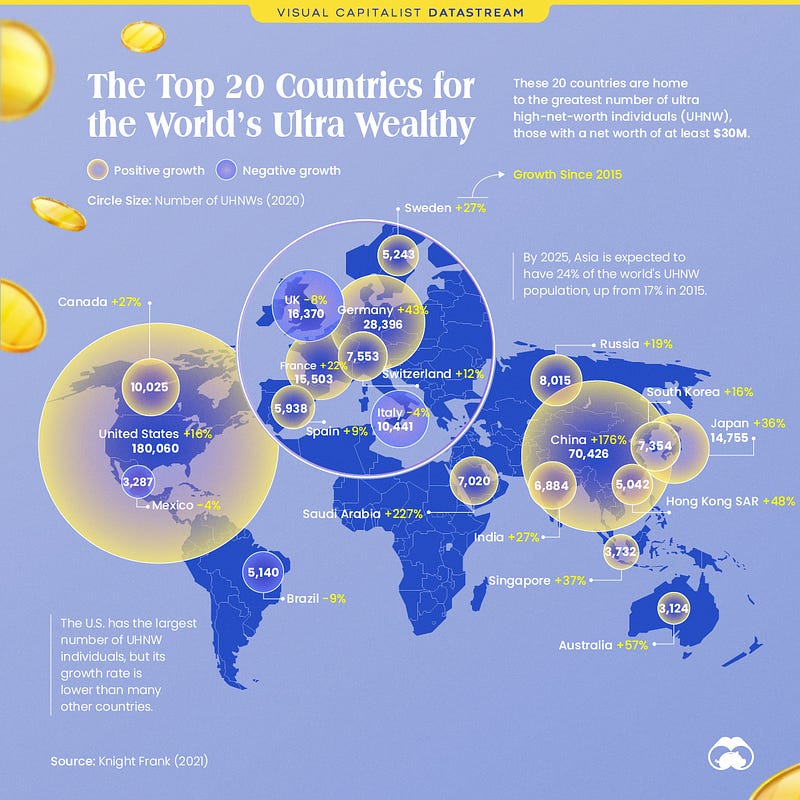
Global Business Week: Top 20 Countries with Ultra High Net Worth Individuals
The state of Financial markets & Economies, Weekly Charts, Business Trends & Statistics
FOMC meeting was the focus of investors and markets last week, as the U.S central bank reiterated its dovish stance saying it would support the economy for as long as it takes. The Feds also upgraded the U.S economic growth sharply higher to 6.5% — the largest annual output since 1984. Providing forward guidance it expected unemployment to drop with the inflation forecast to reach 2.4% this year. But the biggest news was a pledge not to raise interest rates until 2024. U.S. equity markets reversed their recent trend yet again on Friday, as the Dow Industrials and the S&P 500 fell, while the Nasdaq posted relatively strong gains.
For the week, however, the Dow and S&P fell 0.5% and 0.8% respectively, snapping two-week winning streaks, while the Nasdaq also lost 0.8% to cap its fourth negative week in five. The 10-year Treasury yield breached the 1.75% level for the first time in 14 months and has now surged about 80 basis points this year. Bank stocks dragged the Dow lower in reaction to the Fed’s decision not to extend a rule exempting U.S. Treasurys from the supplementary leverage ratio.
The US dollar got an uplift Friday after the Federal Reserve declined to extend the relaxation of the supplementary leverage ratio (SLR). The US dollar basket (DXY) continues its recent reverse higher and is now breaking above the 200-day simple moving average. A conclusive break and open of this indicator could push DXY back to and above the March 9 high at 92.53, leaving the dollar at its highest level since late-November. Above here, two swing highs at 94.31 and 94.79 come into view.
Meanwhile, the cryptos remain in a sweet spot as the trading range narrows and the volatility subsides. Strongly bullish sentiment persists in Bitcoin as it trades well above $58k at the time of writing, after posting an all-time high of over $61k. The recent low around $53k and this ATH remain in focus for downside and upside respectively. The fundamentals still support the bullish sentiment.
Today’s featured infographic (above) highlights the Top 20 Countries for Ultra High Net Worth Individuals (UHNWs). Infographic was designed using data from The Wealth Report 2021 by Knight Frank to list the 20 countries with the most UHNW individuals. Despite the global hardships of the COVID-19 pandemic, the world’s UHNWs population increased by 2.4% in 2020, reaching an all-time high of 521,653 — to be considered an UHNW individual, one must have a net worth of at least $30 million.
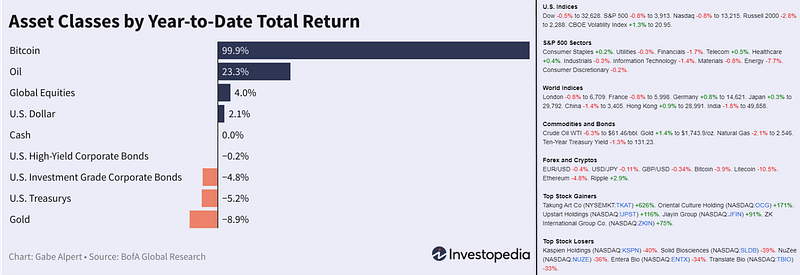
Before moving on to some of the other statistics, here are the weekly numbers of different financial markets and assets (Figure 1).
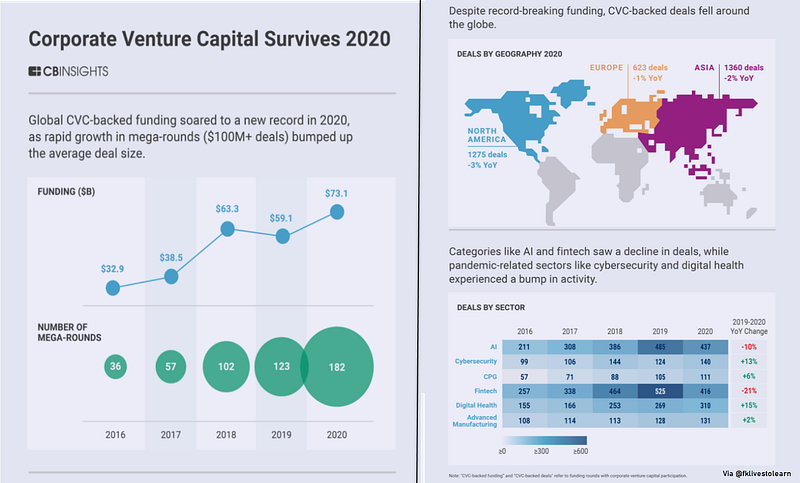
Global CVC Funding Soars in 2020
According to CB Insights, Global Venture Capital soared to a new record despite the negative impact of the pandemic. Asia led with the most number of deals, coming in at 1360, followed by North America at 1275. The total number of funding reached a new high of $73.1 billion with the number of mega-rounds ($100 M+) totaling 182 (Figure 2).
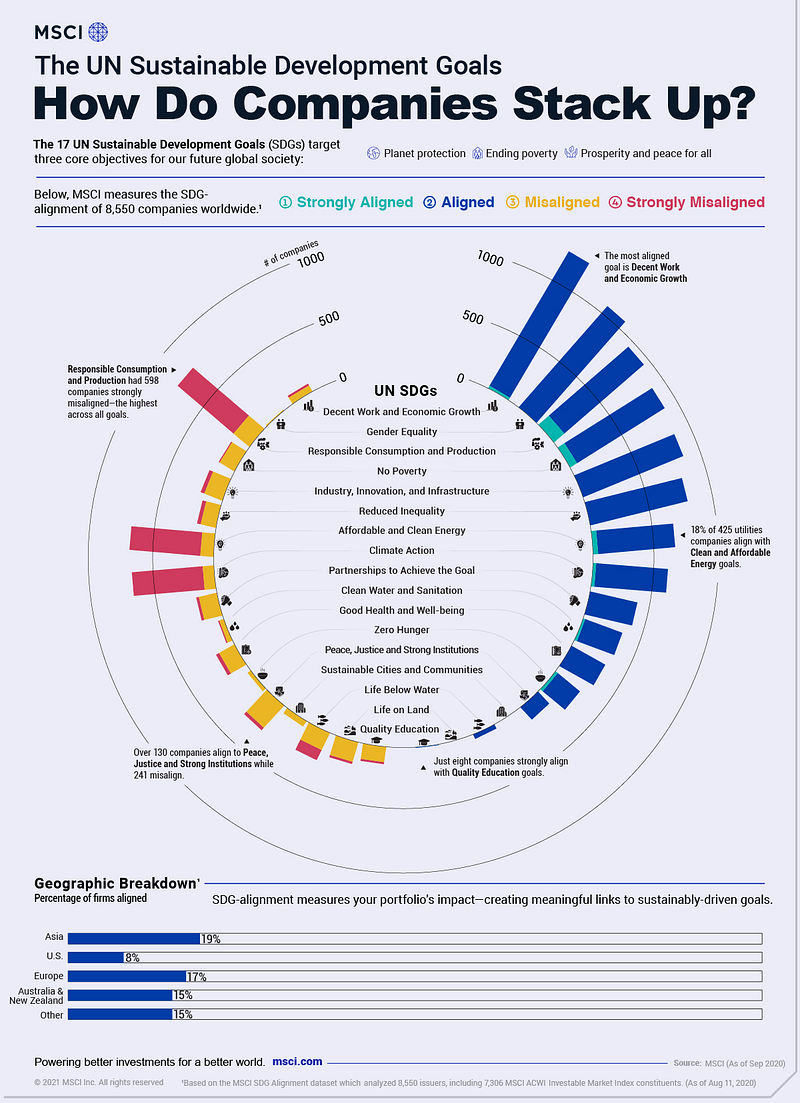
The UN SDGs: How Companies Stack Up
Environmental, social, and governance (ESG) investing witnessed a breakthrough year in 2020 with the most fund inflows on record. For companies that are judged according to ESG metrics, one way to track their progress is through their alignment to the UN Sustainable Development Goals (SDGs).
Established in 2012, the UN SDGs are a blueprint for creating a more sustainable future by 2030 that has been adopted by 193 countries worldwide. As investors and stakeholders pay closer attention to sustainability concerns, the infographic below (Figure 3) from MSCI breaks down how companies stack up according to their alignment to the UN SDGs.
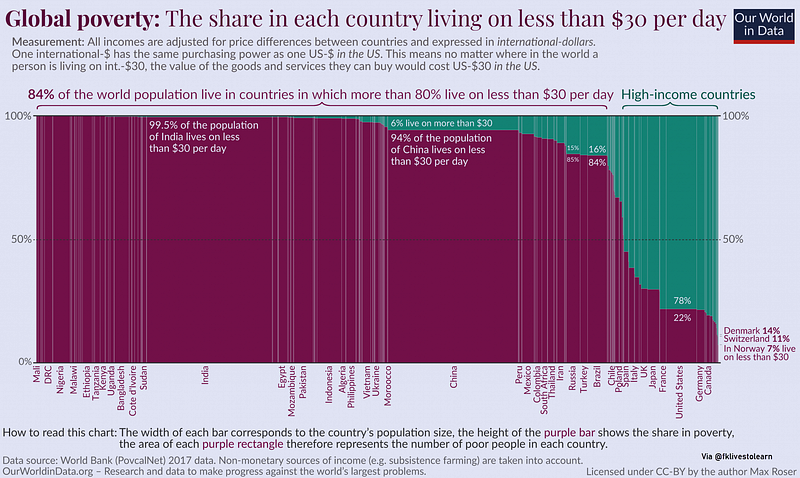
A Snapshot of Global Poverty
The comparison of a high-income country like Denmark and a much poorer country like Ethiopia makes clear just how important this aspect is. A person living in Denmark has a chance of 86% that they are not poor (Figure 4). A person who happens to be born into a country where the average income is low is almost certainly living in poverty. In Ethiopia, more than 99% of the population live on less than $30 per day. This is why a rise in the average level of income in a country — economic growth — is so crucial for reducing poverty.
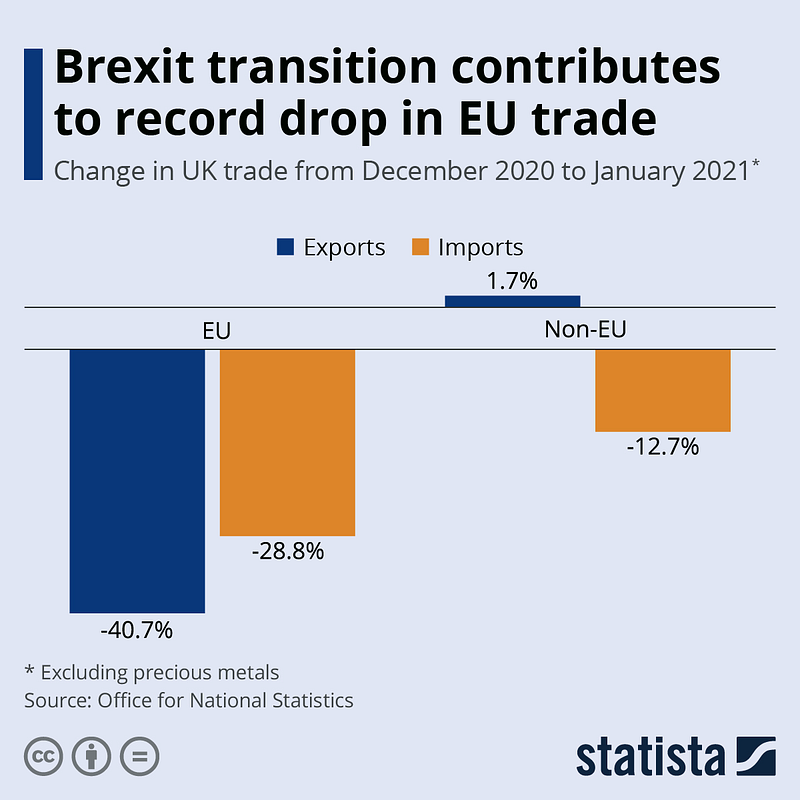
Brexit contributes to a record drop in EU trade
UK trade figures released recently showed a record drop in exports and imports to and from the European Union. At first glance, this may seem like a clear and ominous effect of the Brexit transition ending on 31 December (Figure 5). On closer inspection though, the causes and longer-term consequences aren’t quite so clear yet. Looking at the wider picture once more, the start of a new nationwide lockdown at the beginning of January may also have played its part in the decreases.
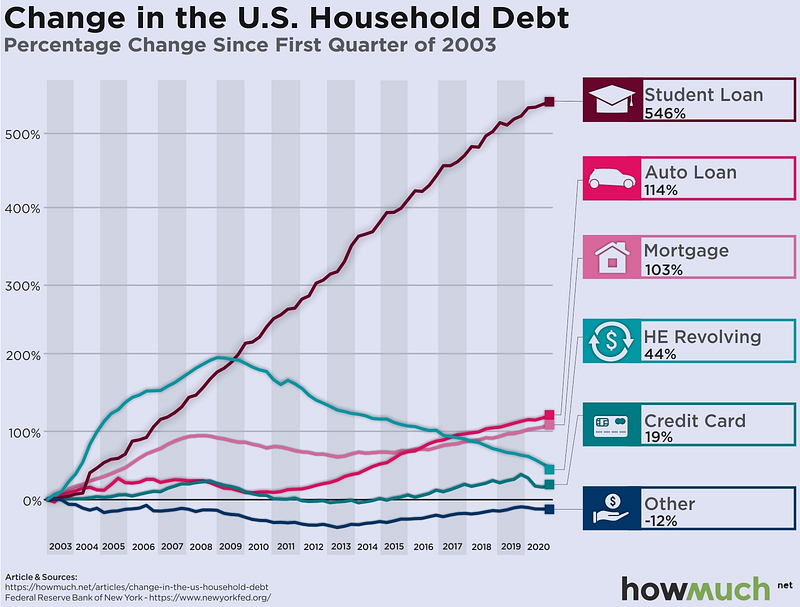
Changes in the U.S Household Debt
The infographic from Howmuch.net highlights how the total household debt has changed across the U.S. over the last several years. Most prominent is the Student loan debt that has exploded over the last 17 years, growing some 546% from 2003 through 2020. Auto loans have also increased substantially, growing by 114% (Figure 6). Every category of consumer debt has increased in the last several years with the exception of other miscellaneous types of debt, which decreased 12% since 2003.
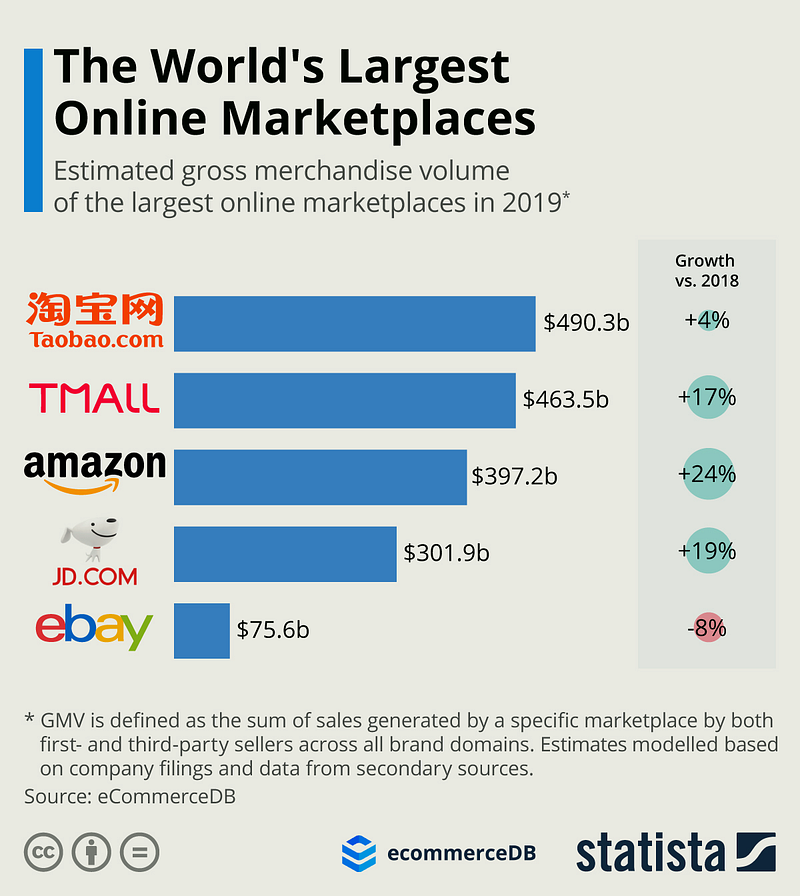
The World’s Largest Online Marketplaces
Thinking about online marketplaces, Amazon and eBay spring to the minds of most Westerners. And yet, they are only ranked third and fifth in the world in terms of gross merchandise volume. According to estimates from Statista’s ecommerceDB, a database profiling more than 20,000 online stores worldwide — Chinese Taobao and Tmall, both owned and operated by Alibaba, are the world’s largest online marketplaces (Figure 7), with GMVs of $490 billion and $464 billion, respectively, in 2019. Amazon ranks third with an estimated GMV of $397, with another Chinese platform, JD.com, and eBay completing the top five.
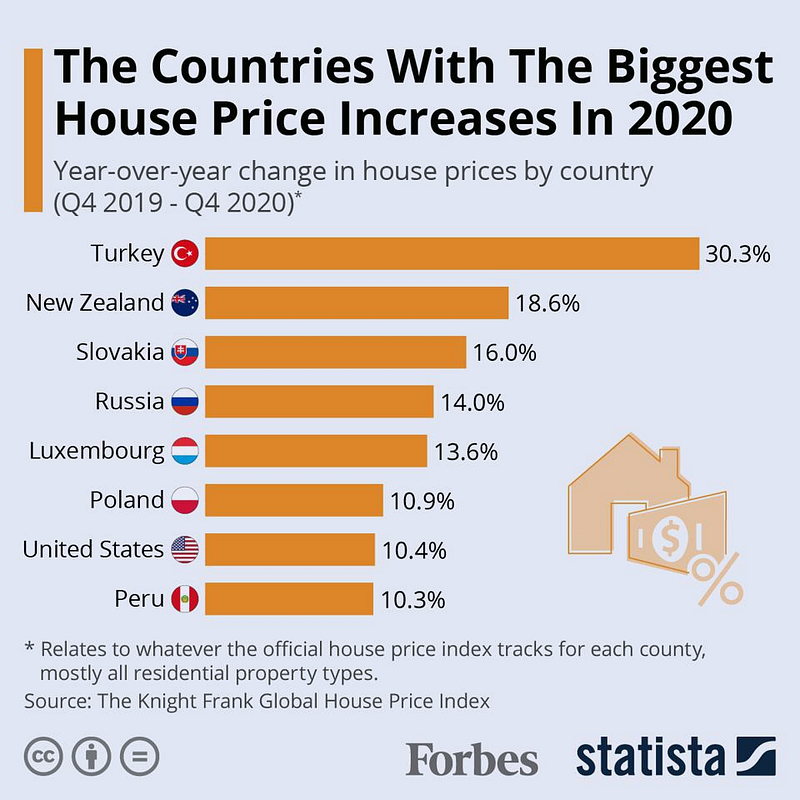
Biggest House Price Increases Globally 2020
Global residential property prices are rising at their fastest rate in nearly three years according to Knight Frank’s latest House Price Index. 89% of the 56 countries and territories analyzed experienced a price increase last year and they rose by 5.6% on average compared to 5.3% in 2019. Several emerging markets posted strong growth and Turkey topped the index for the fourth consecutive quarter— experiencing a 30% hike in its residential property prices between Q4 2019 and Q4 2020 (Figure 8). New Zealand had the second-highest growth in home prices at 19%, ahead of Slovakia’s 16%.
Market Humor: Fed trying to control bond yields
Previous Edition of GBW
