
WEEKLY BUSINESS ROUNDUP
Global Business Week: Top 10 Richest People in various categories
The state of Financial markets & Economies, Weekly Charts, Business Trends & Statistics
Rising 10-year U.S. Treasury yields were again the central theme in the U.S equity markets last week. While some of the investors continued to be spooked by the rising yields, they reflect the belief in the strength of the economic recovery, coming out of the pandemic. A round of late-afternoon buying on Friday boosted the Dow Jones average to another record high as rising optimism around the global economic reopening continued to encourage the rotation into cyclical stocks.
This move to cyclical stocks led to a drag on the tech benchmark index Nasdaq, which closed down 0.6% on the last trading. However, all three benchmark indices closed higher for the week with Dow posting a fresh new all-time high on Friday — weekly gains stood at 4.1% gain for the Dow, while the Nasdaq jumped 3.1% despite its see-saw action and the S&P 500 added 2.7%. The week also saw a resurgence of “meme stock” trading with wild moves in GameStop, Koss & AMC Entertainment.
The benchmark dollar index saw some bearish consolidation this week, although it bounced back from a three-day losing streak ahead of the Federal Reserve interest rate decision on March 17. A lot will depend on the forward guidance from the FOMC in the wake of the massive $1.9 trillion stimulus bill. For now, though, DXY is afloat amid the rise in treasury yields. A short-term bullish channel still seems to be in play.
Bitcoin charting yet another all-time high and the wildly popular NFTs were talks of the town last week in Cryptoverse. BTC is actually bursting higher — trending close to $61.2k at the time of writing. While the Alt. coins are tracking the premier digital currency higher, the gains are much more muted in these cryptocurrencies. The total market cap for cryptos is fast approaching $2 trillion as Bitcoin reaches out to the moon and beyond.
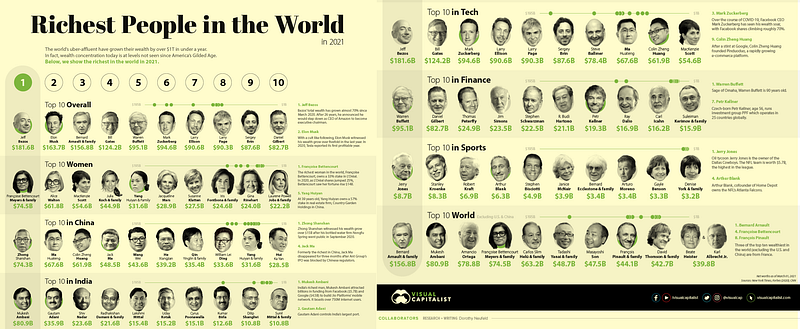
Today’s featured infographic was compiled with the data from the Forbes Real-Time Billionaires List — looking at how the wealth of various ultra-rich groups have changed since the beginning of the pandemic. Over $567 billion has been amassed by the 10 richest people in the world in less than a year, that’s a 7x increase in the wealth accumulated by the top 10 in the time period prior. Elon Musk alone witnessed his wealth increase at least 500% in the last year.
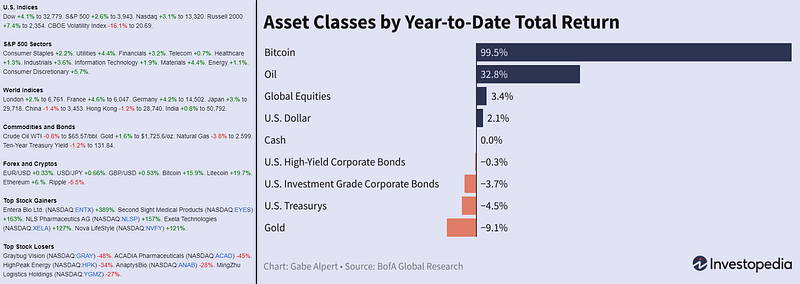
Before moving on to some of the other statistics, let’s review the weekly numbers for global markets and assets (Figure 1).
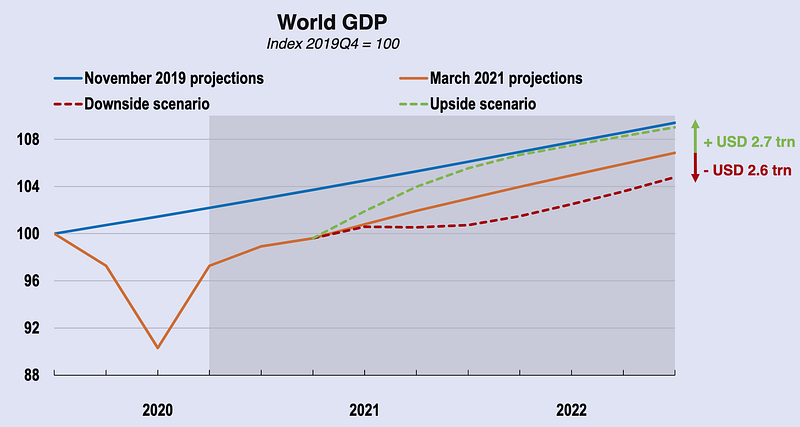
OECD Revises Global Growth Forecast
The Paris-based organization OECD upgraded its global GDP forecast for 2021 by 1.4 percentage points to 5.6% as the largest economy in the world prepares to inject trillions in the stimulus (Figure 2). Global output is now expected to surpass pre-pandemic levels by mid-2021, and the growth forecast for 2022 was also raised slightly to 4%. OECD added that faster vaccine deployment is “critical” for a stronger recovery. Downside risks were considered as the tightening of mobility restrictions again during the latter half of 2021.
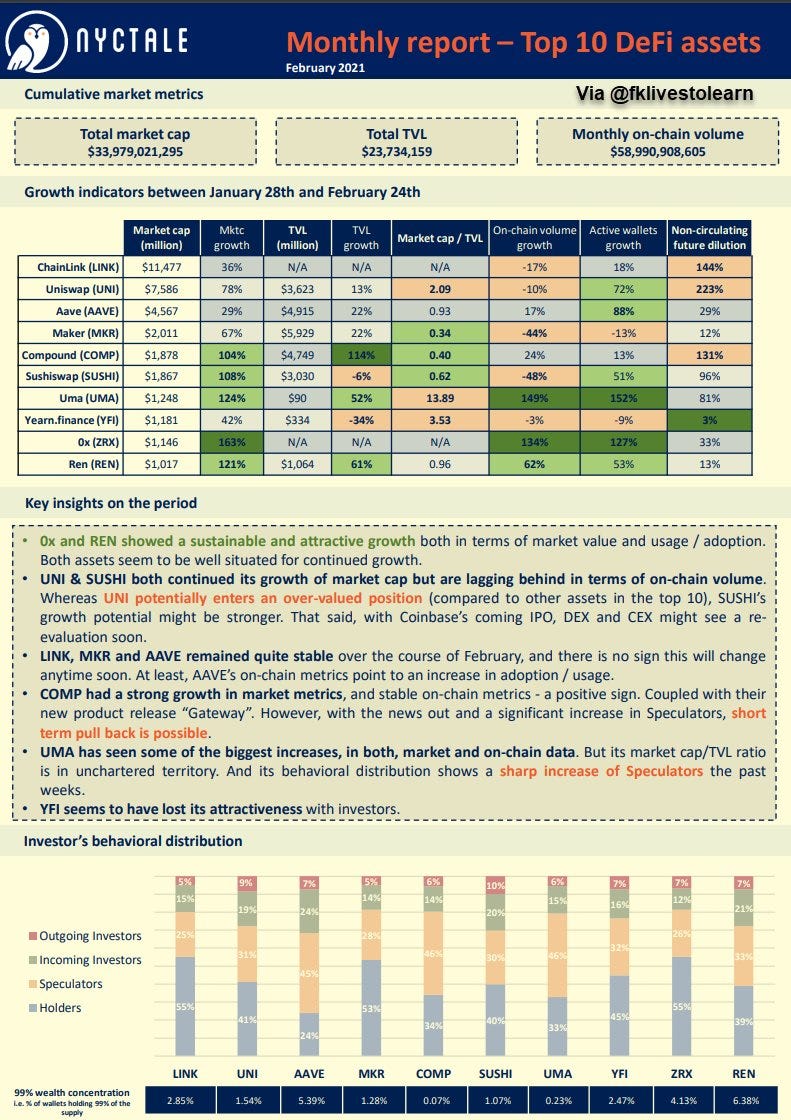
Top 10 Defi Assets: Feb. 2021
According to Nyctale Analytics, ChainLink led the pack with the highest Marketcap in Defi assets and showed stable growth along with MKR and AAVE (Figure 3). UNI & SUSHI both continued their growth of market cap but are lagging behind in terms of on-chain volume. While UMA has seen some of the biggest increases, in both, market and on-chain data. Total Value Locked (USD) in Defi assets at the time of writing stood at $45.6 billion.
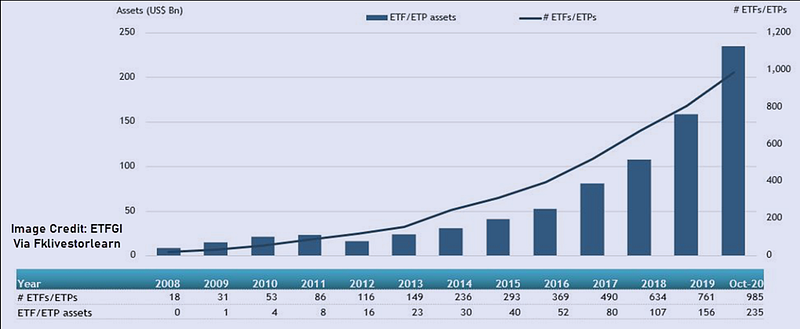
Massive Growth in ETF/ETP Assets
More than half of U.S. investors in the BBH survey said they plan on buying a semi-transparent, active ETF in the next six months, but around 5% admitted they don’t know what that is. That’s because this model only started receiving approval from the U.S. Securities and Exchange Commission at the end of 2019. Active managers of such funds can disclose all their holdings on a monthly/quarterly basis instead of daily, which means they can keep their ideas top secret and avoid traders front-running their moves. The biggest U.S. brands with such ETFs are Fidelity, American Century, and T Rowe (Figure 4).
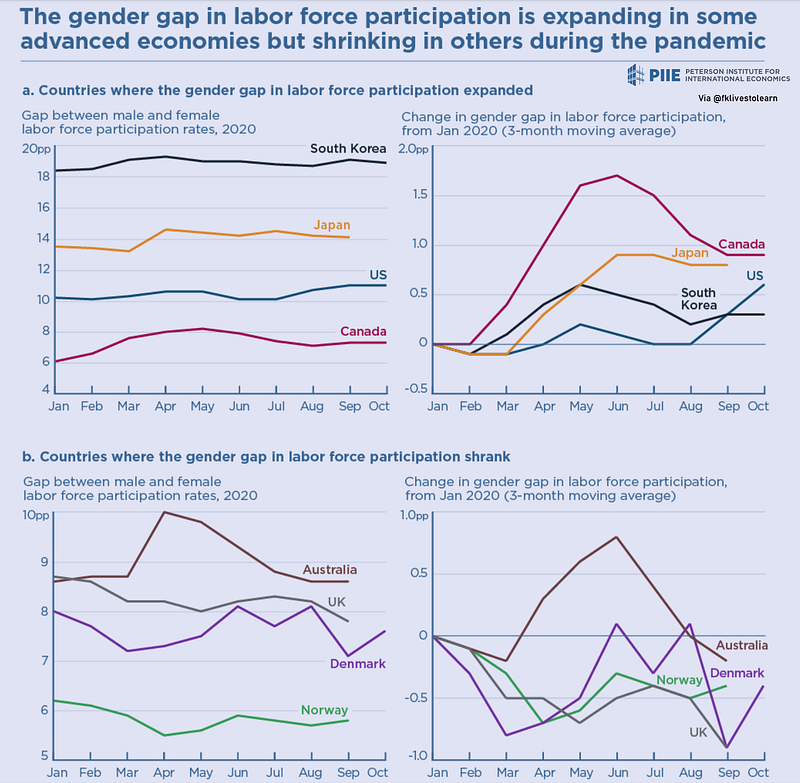
Gender Gap Labor Force Participation Disparity
As evident from the chart below, Gender force labor participation disparity is evident in advanced economies — as it expands in some of these countries while shrinking in others, during the pandemic (Figure 5).
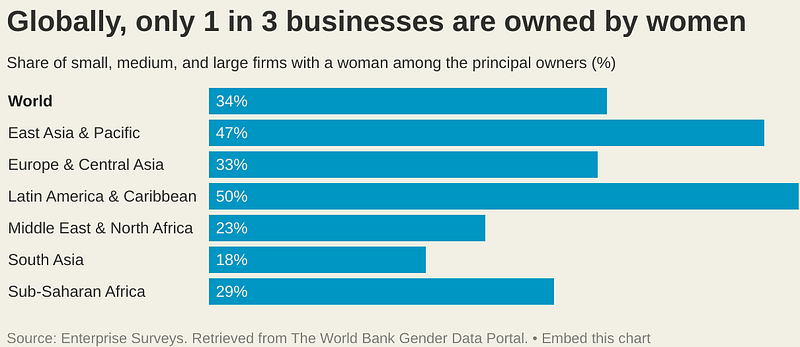
Women Business Owners Around the World
According to the World Bank, globally only one in three medium and large businesses are owned by women. This rate varies across and within regions, from a low of 18% in South Asia to a high of 50% in Latin America & the Caribbean (Figure 6). In East Asia & the Pacific, South Korea has the lowest rate of women business owners, with just 19% of firms, and the Federated States of Micronesia has the highest, with 87% of firms owned by women. Similarly, in the Middle East, it goes from a low of 7% in the Republic of Yemen to a high of 49% in Tunisia.
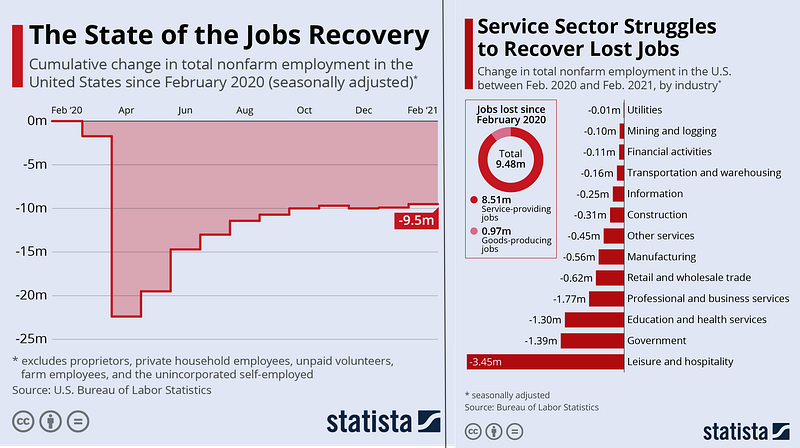
State of Jobs Recovery in the U.S
According to the data from the U.S Bureau of Labor Statistics, the jobs recovery, in general, is going slower than many people had originally hoped. After a quick initial rebound, job gains slowed to a crawl in recent months, as the third wave of COVID-19 rolled over the country. 12 months into the pandemic, total nonfarm employment is still 9.5 million jobs short of February 2020 levels (Figure 7). The leisure and hospitality sector remains the most heavily affected by the pandemic-induced jobs crisis, where the number of jobs in leisure and hospitality still trails pre-pandemic levels by 3.5 million.
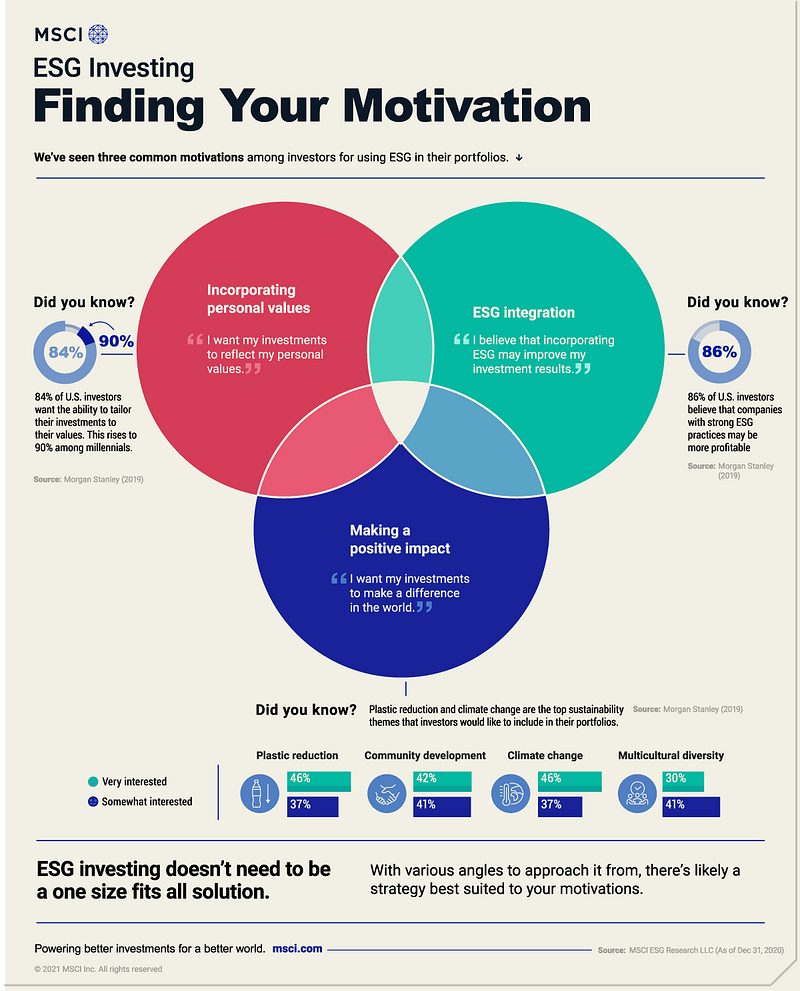
ESG Investing: Finding Your Motivation
Environmental, social, and governance (ESG) factors are a set of criteria that can be used to rate companies alongside traditional financial metrics. Awareness around this practice has risen substantially in recent years with sustainability goals in mind for the future, but how can investors determine if it’s a good fit for their portfolio? To answer this question, MSCI has identified three common motivations for using ESG in one’s portfolio, which have been outlined in the infographic below (Figure 8).
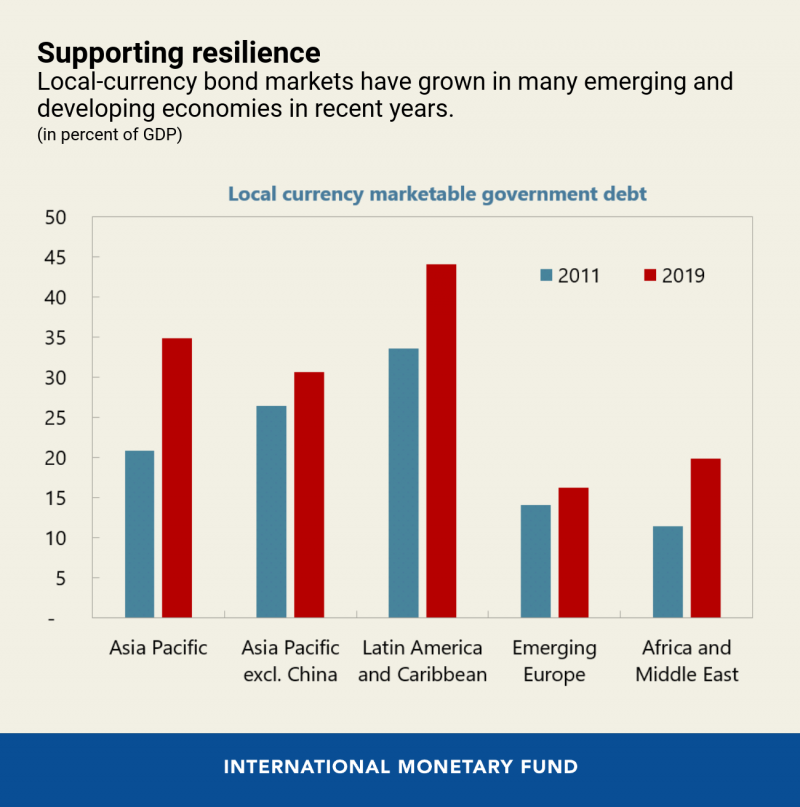
Growth of Local-currency Bond Markets
Government expenses like Paychecks for teachers, new hospital equipment, social assistance programs, and other public expenditures depend to a large extent on its ability to fund them. When governments — particularly those in emerging and developing economies — need money to pay for these and other goods and services, they often turn to international bond markets, where they interact with investors seeking to buy government bonds. But borrowing in foreign currencies in these markets comes with the additional risk of volatile exchange-rate movements. To avoid risks from currency fluctuations, many have invested large resources in recent years to develop local-currency government bond markets (Figure 9).
Market Humor: Volatility Picks Up With All Eyes On Next Week’s Fed Meeting
Previous Edition of GBW
