
WEEKLY BUSINESS ROUNDUP
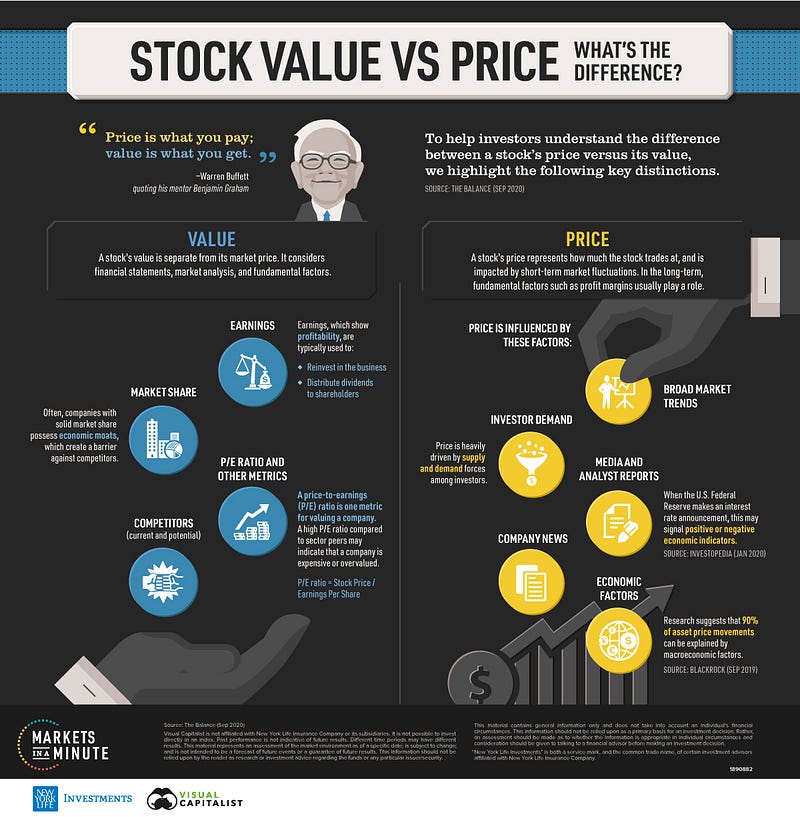
Global Business Week: What’s the difference between stock price & its value?
The state of Financial markets & Economies, Weekly Charts, Business Trends & Statistics
Another choppy week for the U.S stocks ended but on a positive note. Friday saw its fair share of drama as well, with a better than expected NFP jobs report caused investors to run for cover as government bond yields initially climbed to 1.62% — before receding to 1.56% by the end. Despite all the noise around major correction in the benchmark index S&P 500, it is only down 3% from its record high set just a few weeks ago.
The dominating theme in the markets continues to be rising yields, sector rotations, and the collapse of popular stay-at-home stocks like Zoom and Peloton. For the week, the Dow Jones gained 1.8% thanks to the Friday rally and the S&P added 0.8%, but the Nasdaq still fell 2.1% despite Friday’s bounce.
The US Dollar propelled higher after an impressive U.S jobs report for February crossed the wires. Greenback’s strength against Majors was reflected in accelerated strength in the benchmark index of the reserve currency. The optimism around vaccination distribution and strong economic data in the U.S is sustaining the gains in DXY. Technically, DXY is at the cusp of turning the medium-term bias from bearish to neutral. The tide might just have turned for the dollar bulls.
Prices in Cryptos remained a little subdued this week as Bitcoin (BTC) posted a lower high around $52,600. With the support in the $42k-$44k holding, BTC seems to be consolidating. Similar is the case with Ethereum and some of the other digital assets. The institutional interest remains strong in the digital assets and there is no change to the overall bullish picture.
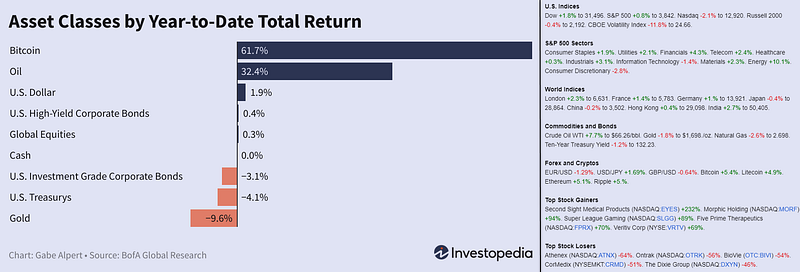
Today’s feature infographic (above) from Markets in a Minute chart from New York Life Investments shows the key forces that impact both price and value to help investors harness a deeper understanding of their investments. Before moving on, here are the YTD numbers for various markets.
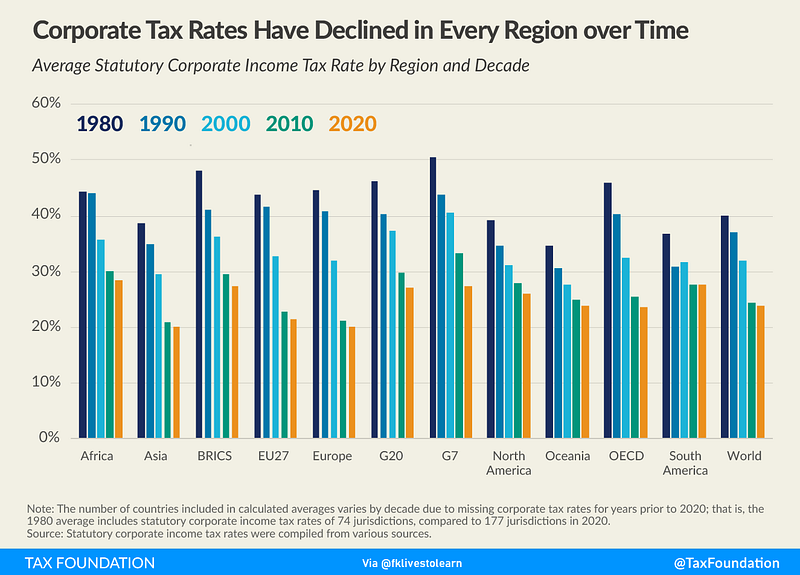
Corporate Taxes Set to Rise Globally
Corporate tax rates have been falling globally for decades now. According to the Tax Foundation, in 1980, the average worldwide tax rate was 40.11%. In 2020 it stood at 23.85%, representing a 41% reduction over the 40 years surveyed (Figure 2). However, heavy government borrowing and rising deficits during the pandemic would mean that corporate taxes are on their way up again. That seems to be the case in the U.K. Also in the U.S, President Biden has promised to raise the corporate income tax rate to 28% from 21%. The $1.9 trillion stimulus package also includes a tax increase on large corporations that’s harder to spot.
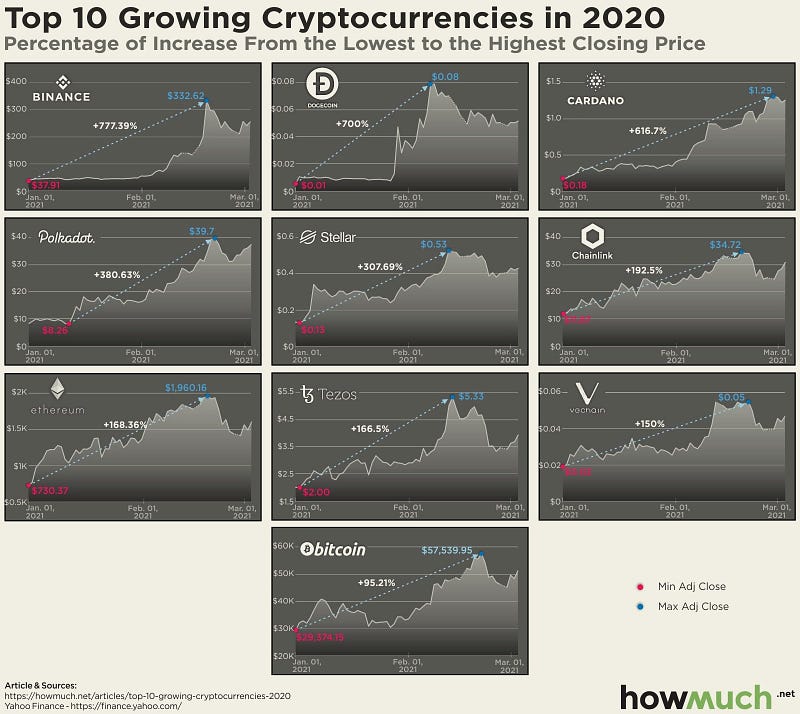
Top 10 Cryptocurrencies in 2020
Cryptocurrencies saw their values soar in 2021. Big companies like Paypal dove into the market, creating greater access. Demand skyrocketed alongside equity markets as troves of new institutional investors snatched up various cryptocurrencies. And surprisingly, Bitcoin wasn’t the top performer. Here is the infographic highlighting the biggest gainers in the digital realm last year (Figure 3).
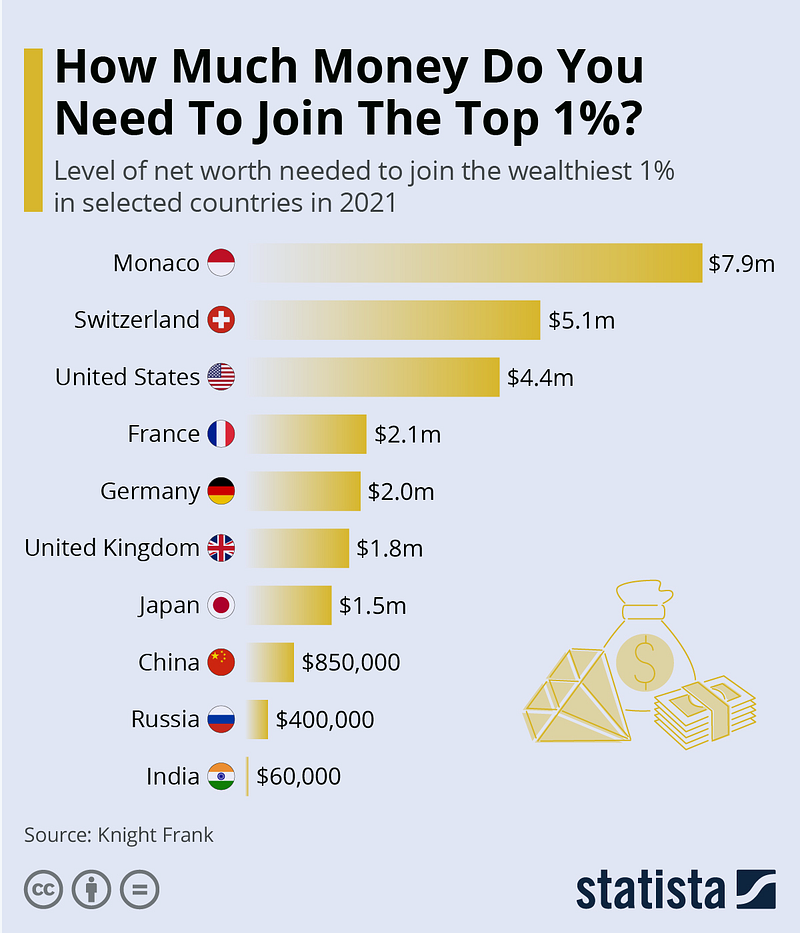
Joining the Top 1% of the Wealthy
According to the global UHNWI population (an ultra-high-net-worth individual who has a net worth of $30 million or more) climbed 2.4 % over the past year with growth strongest in Asia at 12% (Figure 4). Growing inequality is increasingly been seen as the greatest threat to future wealth accumulation and support for wealth taxes is rising in many parts of the world with such plans already proposed or in place in Argentina, Canada, and South Korea with similar measures likely to be introduced elsewhere.
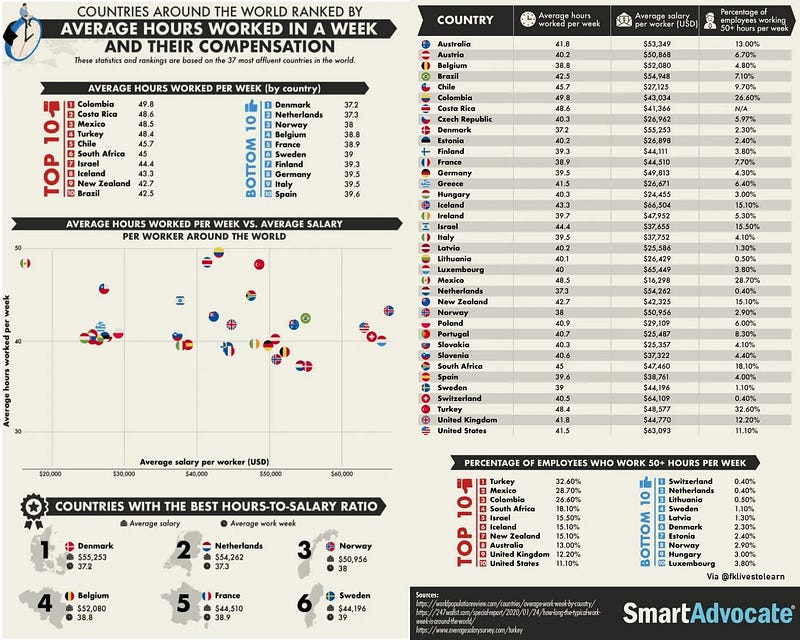
Comparing Hours Worked & Average Compensation
Here is an interesting infographic highlighting the average number of hours worked around the world globally & their associated compensation (Figure 5). Columbia ranked highest with 49.8 hours of the workweek with Denmark with the least at 37.2 hours. Countries with the best hours-to-salary ratio included Denmark, Netherlands, Norway, Belgium & France — making the Top 5.
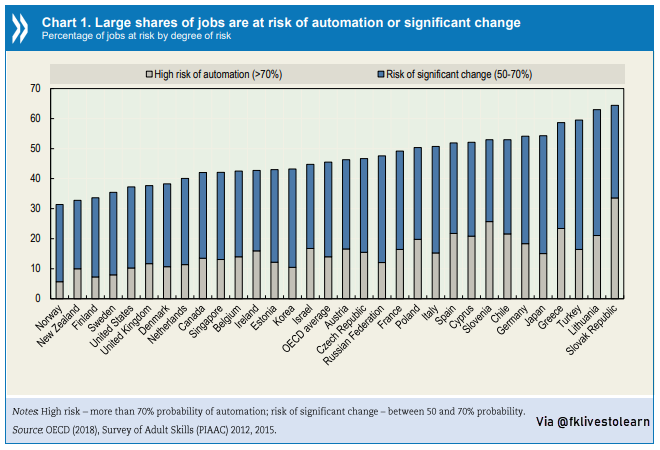
Large shares of Jobs at Risk of Automation
A recent survey of the OECD countries suggests that large swaths of jobs in these countries are at risk of automation (Figure 6). The distribution in each bar between grey and blue line highlights the risk of automation.
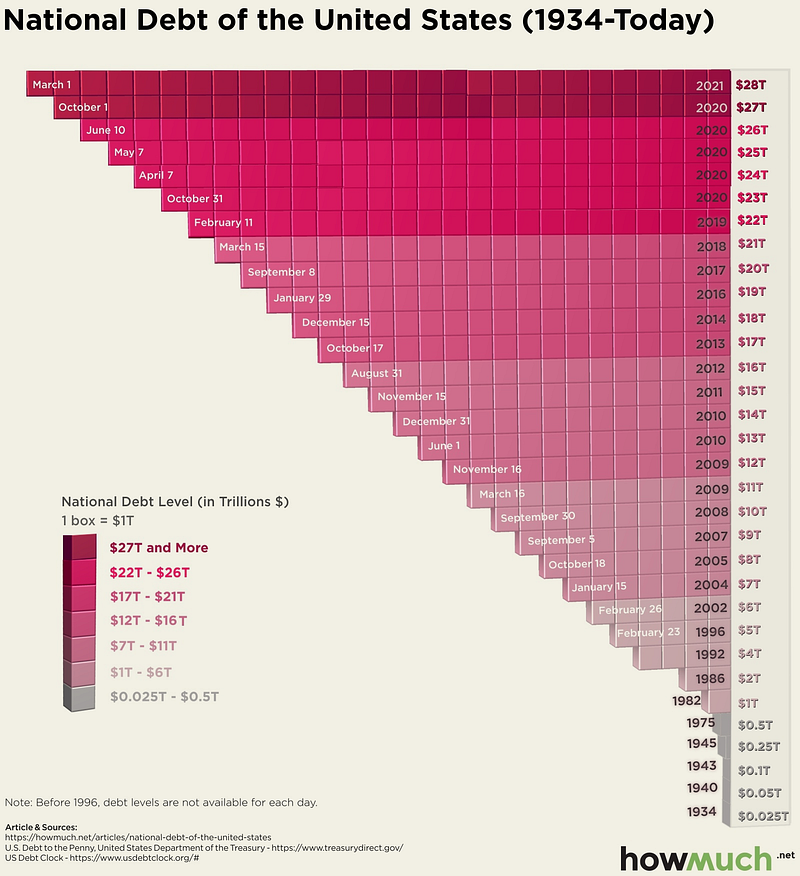
U.S National Debt Soars to $28 Trillion
In March 2021, the national debt hit an eye-popping $28 trillion, coming off the back of a $2.2 trillion stimulus passed by the U.S. Congress last year and prospects for another one in the coming months (Figure 7). The Congressional Budget Office expects national debt to double to 202% of GDP by 2051. You can check out the U.S. debt clock in real-time here.
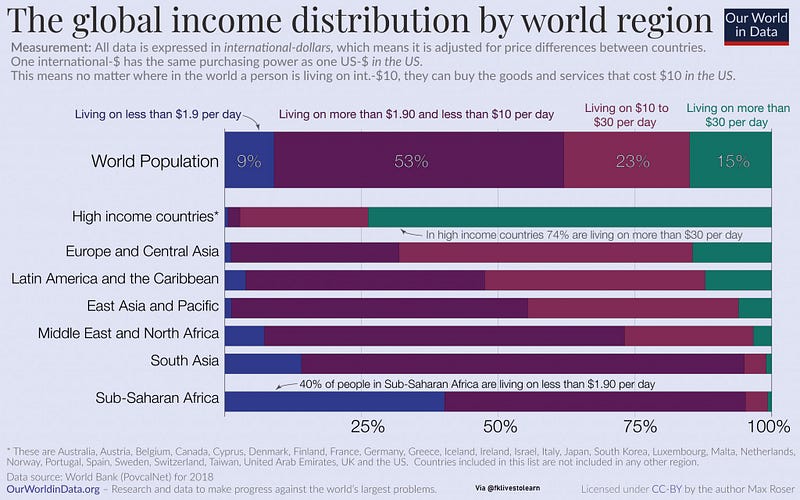
Poverty still a Major Global Issue
Data from the World Bank shows that poverty remains a major issue in many countries of the World. The chart from Our World in Data shows that 9% of the global population still lives below the poverty line — living on less than $1.90 per day. But the proportion is much high in some other regions. 40% of the people in Sub-Saharan Africa live in extreme poverty (Figure 8). And the pandemic is skewing this statistic towards the poverty statistic even more.
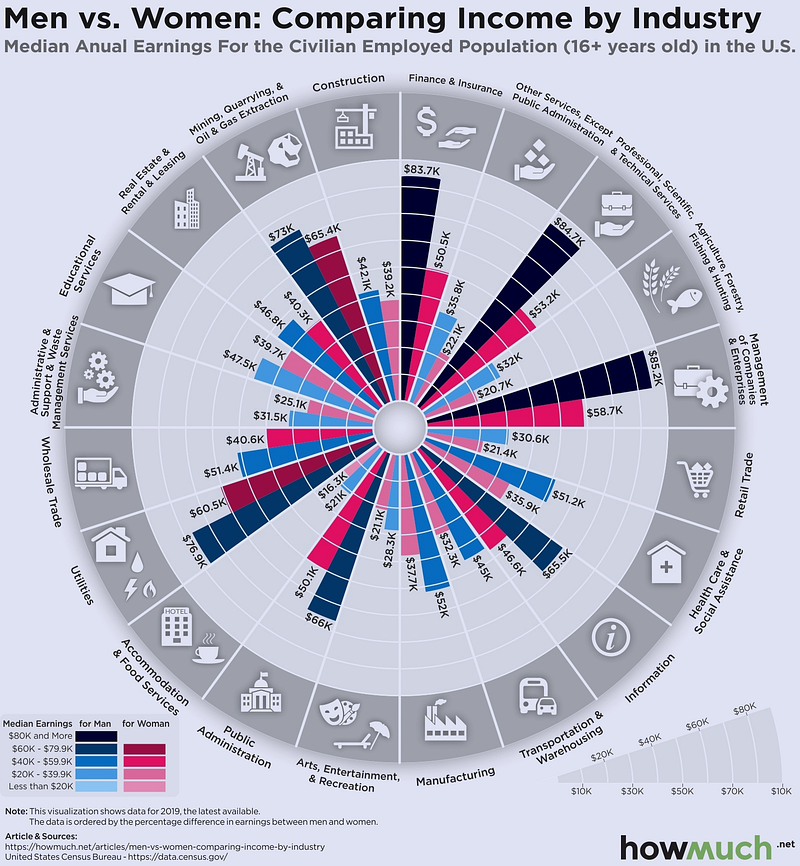
Visualizing the Massive Gender Pay Gap in the U.S
The visualization below (Figure 9), according to the data from the US Census Bureau, reflects median earnings for men and women in 2019 inflation-adjusted dollars. The data suggests that women make less money than men across several different industries in the U.S. economy, including educational services, health care, and food services. Across the entire U.S. economy, median male earnings were $45,893 compared to $32,436 for women. In other words, women’s earnings are only 70.7% of men’s.
Market Humor: Bears Not Pleased with Powell

Previous Edition of GBW
