

WEEKLY BUSINESS ROUNDUP
Global Business Week: What is a SPAC & what are its advantages?
The state of Financial markets & Economies, Weekly Charts, Business Trends & Statistics
Rising bond yields have pushed the market lower off-late. Despite a Friday rebound, The major U.S averages finished last week with sharp losses following an earlier selloff sparked by surging yields. The yield on the 10-year U.S. Treasury backed off of recent highs of 1.6% to close the week at 1.39%. All three major indexes closed lower for the week, with the Nasdaq posting its worst week since October.
It was a wild week for the U.S equity markets. Fears of higher rates and inflation weighed on all three major averages, as the Dow Jones dropped 1.8%, the S&P 500 slid 2.5%, and the Nasdaq tumbled 4.9%. Investors continued to rotate from technology stocks to industrials, financials & energy stocks, given the improving economic outlook.
Against an average of its major counterparts, the Euro, British Pound, Australian Dollar, Canadian Dollar & Japanese Yen, the US Dollar experienced its best week in about 4 months. The safe-haven reserve currency capitalized on a couple of trends in financial markets that may leave it in a position to benefit from again in the next week — a combination of reflationary expectations and rising longer-dated Treasury yields. For now, the benchmark dollar index has reversed sharply from the psychological 90.00-support level.
Exactly in tandem, with the Greenback gaining, Bitcoin and the associated cryptos all lost ground this week. At the time of writing, Bitcoin is trading around $47,300 after falling down in excess of 20%+ from its all-time high earlier. Other cryptos have seen similar losses, hovering around their support levels. The exception has been Cardano, seeing massive interest from investors after the network upgrades. The ADA coin has in fact become the third-largest crypto coin, with a market cap in excess of $43 billion.
Today’s featured infographic (above) depicts the SPAC mania has taken hold of public markets. A special purpose acquisition company (SPAC) is a “blank check” shell corporation designed to take companies public without going through the traditional IPO process. Though SPACs have been around for decades, the financial maneuver has gained traction in recent months.
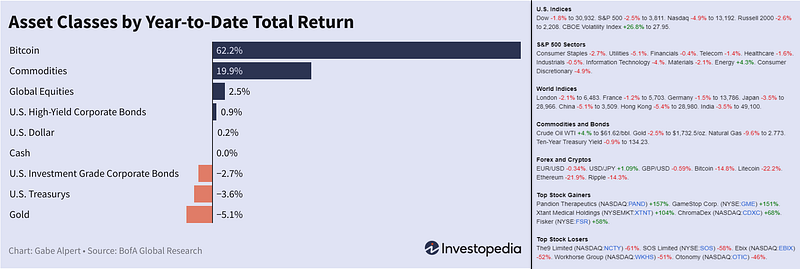
And as usual, here is the performance of various markets & assets (Figure 1), before moving on to some of the other statistics in the financial world.
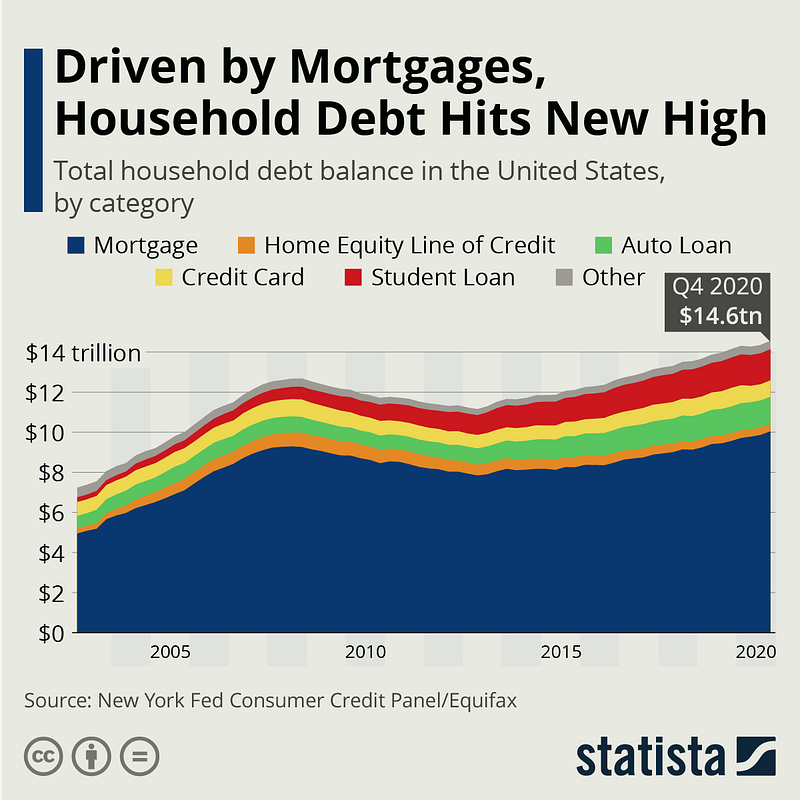
U.S Household Debt Hits New High
According to the New York Fed’s latest Household Debt and Credit Report, U.S. household debt climbed to a record high of $14.6 trillion at the end of 2020, as mortgage debt surpassed $10 trillion for the first time (Figure 2). mortgage debt increased by a whopping $183 billion over the past three months alone. The increase was mainly driven by a record volume of mortgage originations, as many households took advantage of historically low mortgage rates to refinance their mortgages and even take out some cash in the process.
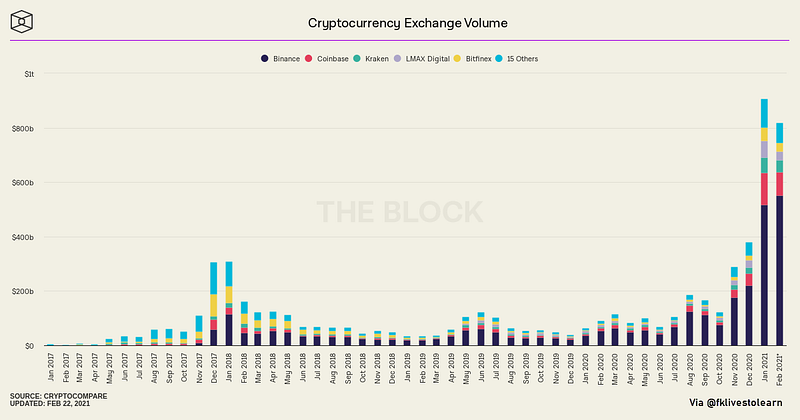
Cryptocurrency Exchange Volume Soars in 2021
U.S. cryptocurrency exchange Coinbase was valued at just over $100 billion in a recent private market share sale ahead of its public offering, reported Axios. The company, which has filed to go public via a direct listing, had more than 43 million registered users and over $90 billion in assets at the end of 2020. The charts below (Figure 3) show volumes on exchanges that soared along with prices in recent months. First two months of 2021 have broken all previous records.
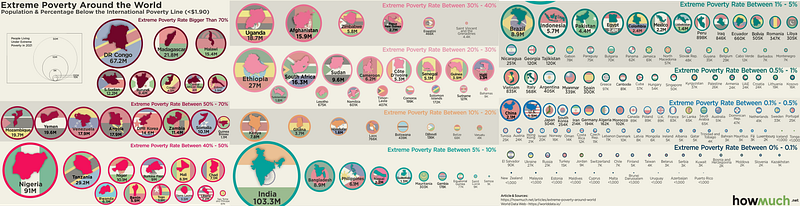
Visualizing Extreme Poverty by Country
The World Data Lab provides real-time estimates and projections at the country level, presenting the total population and estimated size of people living in extreme poverty. Howmuch.net has prepared a visualization for the data (Figure 4) — where extreme poverty is defined as people living on less than $1.90 per day. According to the data, South & Central America and Africa contain the majority of the countries with high percentages of the population living in extreme poverty. Whereas, extreme poverty for developed countries such as the United States and countries in Europe range between 0.1–0.5%. While some smaller countries with strong social safety nets and economies such as New Zealand, Switzerland, and Taiwan have very low poverty rates of below 0.1%.
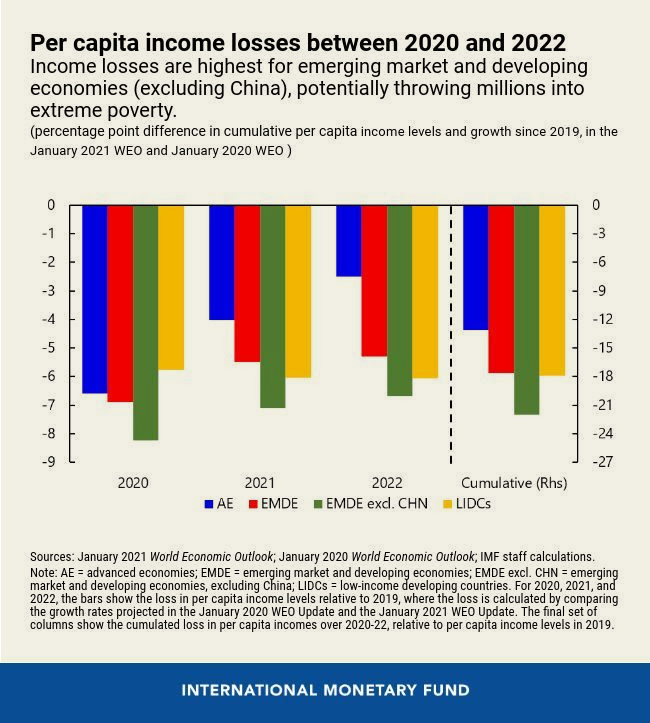
Per Capita Income Losses (2020–2022)
IMF estimates that by the end of 2022, cumulative per capita income will be 13% below pre-crisis projections in advanced economies — compared with 18% for low-income countries and 22% for emerging and developing countries excluding China (Figure 5). This projected hit to per capita income will increase by millions the number of extremely poor people in the developing world. In other words, the convergence between countries can no longer be taken for granted. Before the crisis, we forecast that income gaps between advanced economies and 110 emerging and developing countries would narrow over 2020–22. But we now estimate that only 52 economies will be catching up during that period, while 58 are set to fall behind.
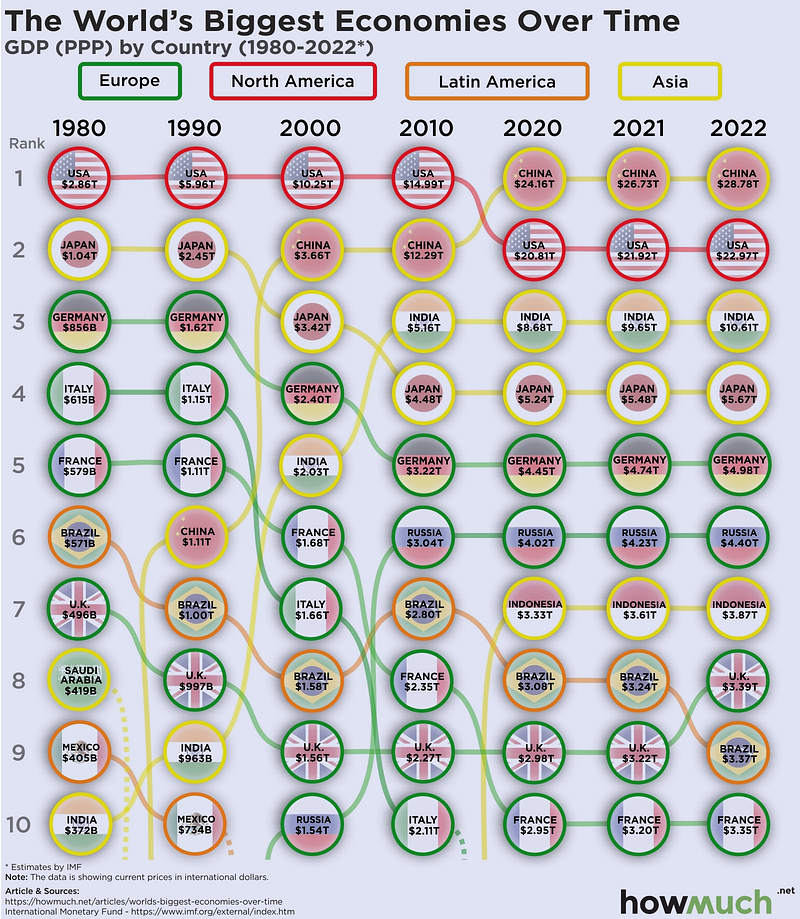
World’s Biggest Economies (1980–2022)
The data for the following visualization (Figure 6) was taken from the International Monetary Fund (IMF). The infographic displays the size of each country’s GDP adjusted to international dollars based on current price figures. The U.S, which has consistently been the largest economy in the world for the last 40 years, growing from $2.86 trillion in 1980 to a projected $22.97 trillion next year, is going to fall behind China — with a GDP of $28.78 trillion in 2022, up from $26.73 trillion this year and $24.16 trillion the year prior. Asian countries reached the top of the rankings, and Western European countries declined. Economists believe the coronavirus pandemic will slow the growth of the global economy, in some cases reversing the rise of underdeveloped countries.
Market Humor: Tesla’s investment in Bitcoin

Previous Edition of GBW
