
WEEKLY BUSINESS ROUNDUP
Global Business Week: 5 Trends for Investors to watch amid COVID-19 Recovery
The state of Financial markets & Economies, Weekly Charts, Business Trends & Statistics
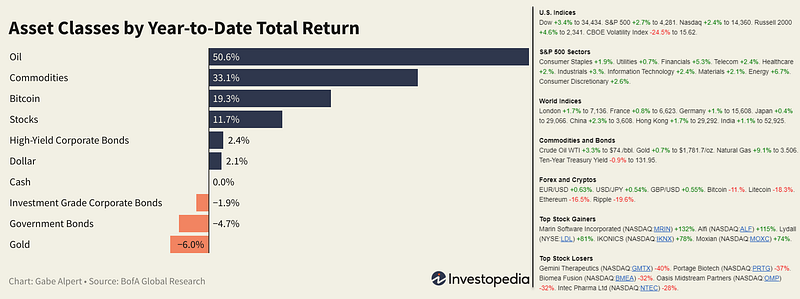
A lack of volatility (VIX) and persistently low Treasury yields are helping investors maintain their enthusiasm for equities — VIX slowed down the past week after rising 27% in the prior 30 days. The underlying demand for service is also painting a bullish outlook for stocks in the second half of the year. The benchmark S&P 500 closed the week at another record high, posting its best weekly performance since February, as investors bet that higher inflation will be temporary as the economy continues to push out of the pandemic.
The U.S equities have broken so many records this year that we are getting tired of reporting them. Most sectors of the stock market rallied this week, as inflation fears receded and more U.S government spending may be on the way via the recently approved bipartisan infrastructure bill. For the week, S&P 500 rallied 2.7%, the Dow gained 3.4% for its best week since mid-March, and the Nasdaq climbed 2.4%.
The dollar index (DXY) failed to keep its bullish traction this week with its choppy sideways action. A slew of Fed officials endorsing dovish forward guidance for monetary policy didn’t help its case either. Having said that, robust economic data out of the U.S may help prop up the Greenback in the short term. The breakout in the US Dollar Index (DXY) appears to have stalled after testing the resistance objective at 92.46. In the medium-term, the gains in DXY might remain capped as long as FOMC is in no rush to scale back its non-standard tools.
Even for the most ardent crypto optimists, a more than 50% plunge in the price of Bitcoin since mid-April is having some in the cryptoverse panicking. At least the technical picture in BTCUSD doesn’t look too good right now, with the premier digital currency hovering around a major support area in the $30k zone. Ethereum is even more anemic trading around $1800. For BTC, this could be a make or break level — if there is any meaningful dive below $30k, a lot of the investors might bow out, but a strong rebound from here could produce another surprise on the upside.
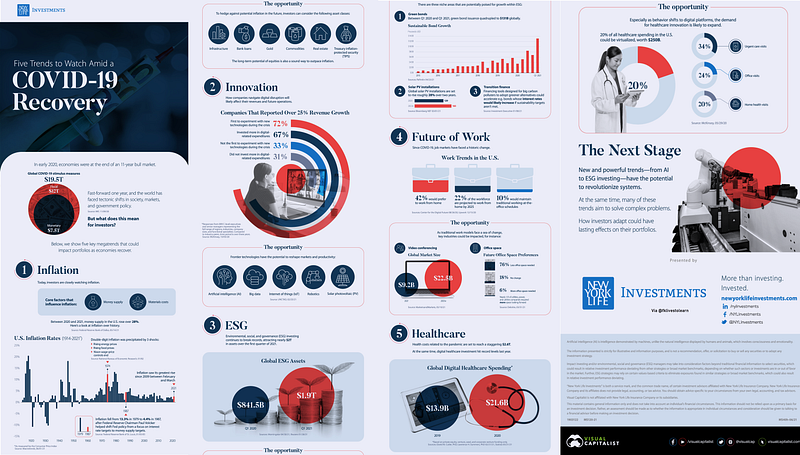
Today’s featured infographic shows how COVID-19 led to tectonic shifts in society, markets, and government policy. People and businesses are rethinking traditional work structures, while inflation concerns are rising amid trillions in stimulus injections. But what impact does this have on investors? To answer this question, this infographic from New York Life Investments pinpoints five trends to watch amid a COVID-19 recovery.
And finally, before moving on to some other statistics, here are the weekly & YTD numbers from various markets and different assets (Figure 1).
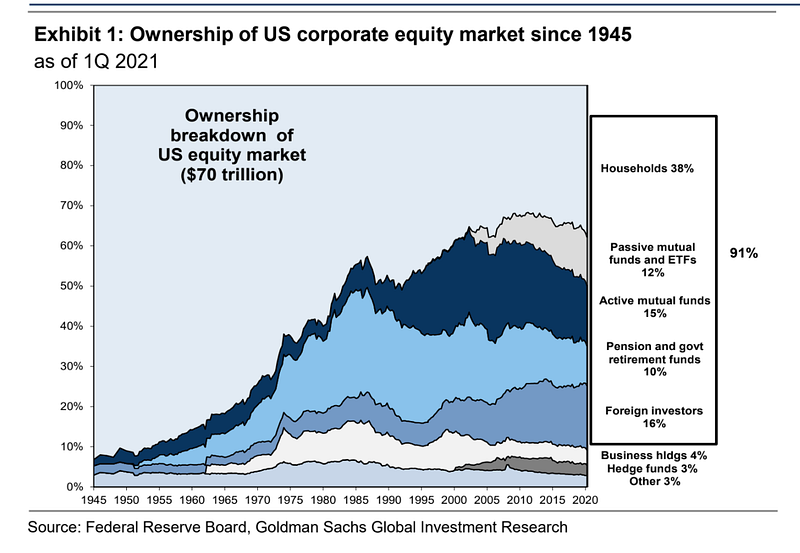
U.S Equity Market Ownership Since 1945
The past year has seen a flurry of government stimulus, government spending, and easy monetary policies. That has been a great recipe for stocks, and investors of all levels have been piling up on equities at a historic rate. According to Goldman Sachs, households, foreign investors, pension funds, and mutual funds, which collectively own 90% of the entire equities market, have an aggregate 49% allocation to stocks right now. That’s near a record high going all the way back to 1990 (Figure 2). Stocks have been one of the only games in town to earn returns lately, and investors of all sizes are historically overweight that asset class.
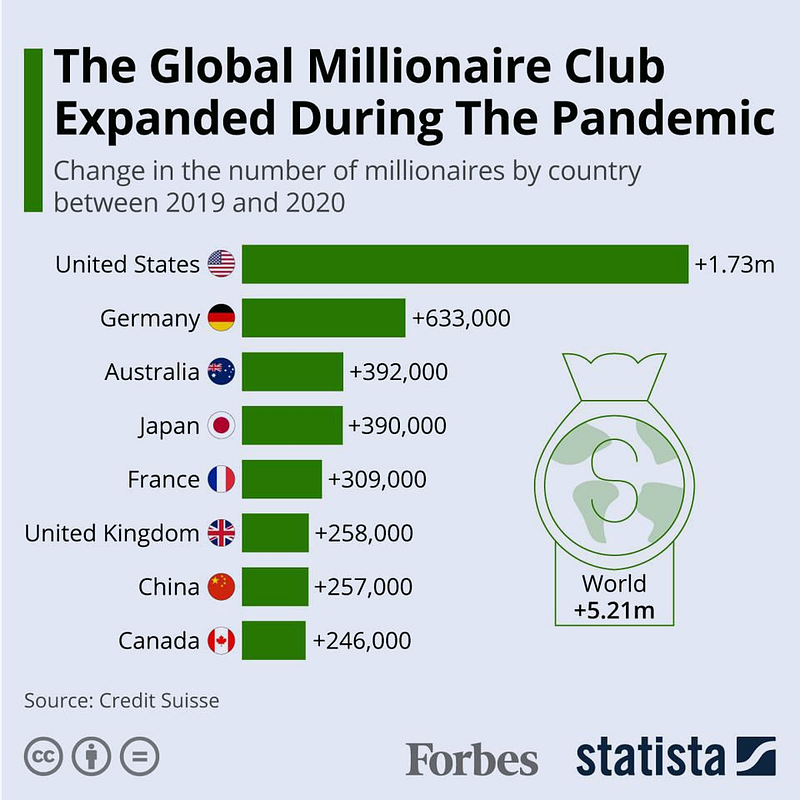
The Global Millionaire Club
The pandemic has proven good news for the world’s wealthiest individuals with 650 American billionaires seeing their collective fortune surge by $1.2 trillion since the crisis erupted. The situation has not just benefitted the super-rich, however, with wealth creation remaining largely unaffected by Covid-19 all over the world. Despite the pandemic’s devastating economic impact and a crippling rise in unemployment, total global household wealth grew 7.4% to reach $418.3 trillion, according to the latest Global Wealth Report from Credit Suisse. Given that trend, it is hardly surprising that the pandemic was not just good news for the super-rich but for most millionaires as well (Figure 3).
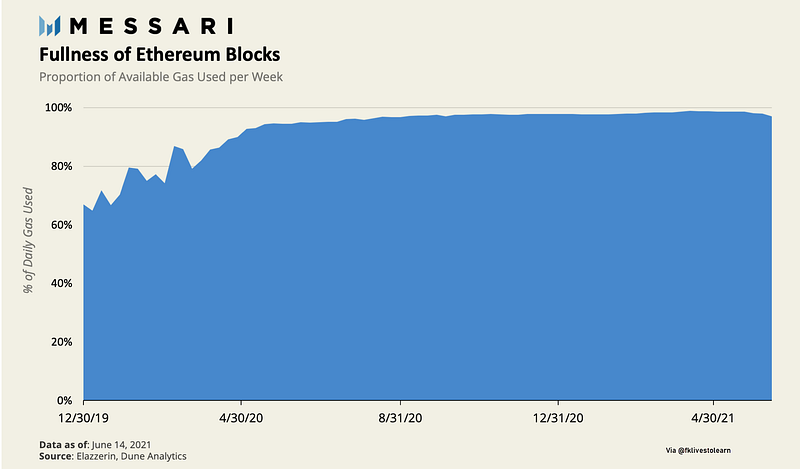
Fullness of Ethereum Blocks
Transactions on Ethereum are slow and costly. In many cases, the gas fees associated with smaller swaps on decentralized exchanges (DEXs) may be more costly than the value of the swap itself. In 2021 alone, Ethereum fees increased 845% compared to the previous year due to the Ethereum network reaching full capacity. Since January 2020 average block capacity has grown from ~70% to a sustained level of 98% (Figure 4). Because of this, scaling solutions have become crucial. No wonder then, that Ethereum 2.0 is being anticipated eagerly.
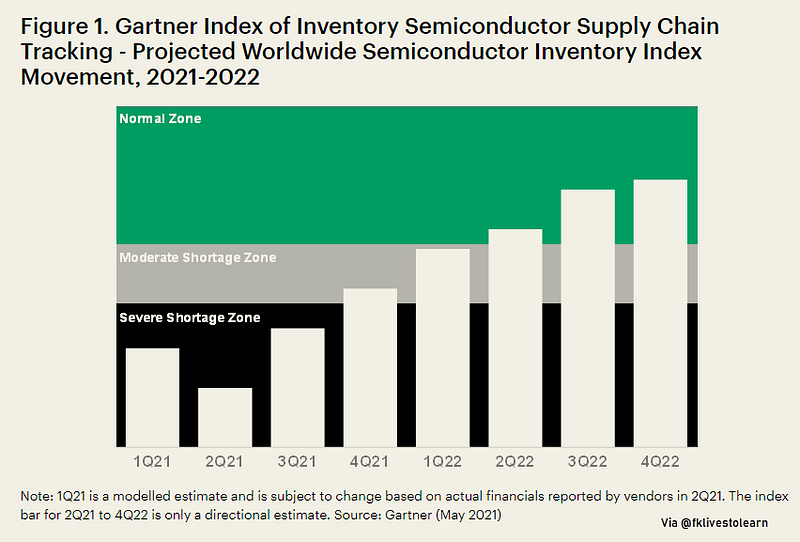
Global Chip Shortage to Persist till Q2 2022
Research firm Gartner said in a press release last month that it expects the global chip shortage to persist until the second quarter of next year (Figure 5). That chip shortage is largely a consequence of the world’s reliance on a single firm that produces around 92% of the global supply of sophisticated semiconductor chips — Taiwan Semiconductor Manufacturing Company (TSMC). In the last year, TSMC has been hobbled by long backlogs, pandemic-related production bottlenecks & geopolitical risks stemming from an increasingly aggressive China.
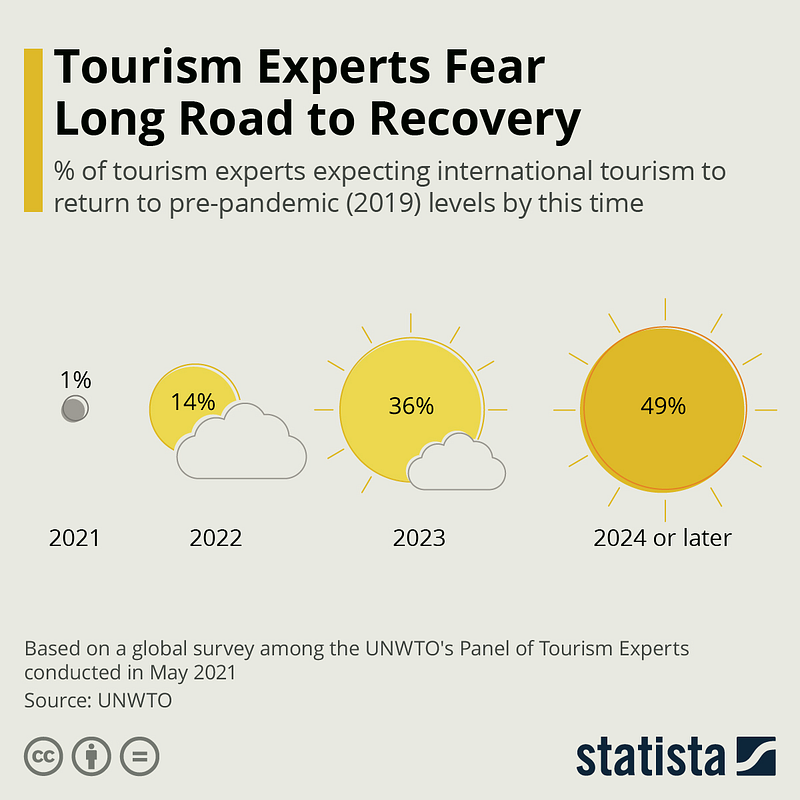
Long Road to Tourism Recovery
According to the United Nations World Tourism Organization (UNWTO), international tourist arrivals were down 83% in the first quarter of 2021 compared to the same period in 2020. Following an estimated $1.3 trillion loss in export revenue in 2020, travel restrictions largely remained in place through the first months of 2021, as governments were desperately trying to curb the spread of new, potentially more dangerous variants of COVID-19. According to the recent UNWTO survey, travel experts remain cautious in their outlook, however, with the vast majority not expecting a return to pre-pandemic levels before 2023 (Figure 6).
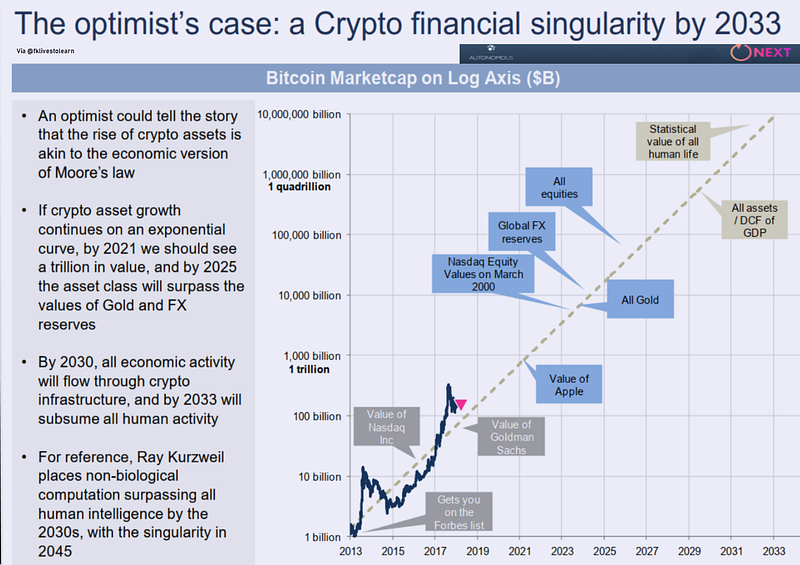
A Crypto Financial Singularity by 2033?
The following chart was made first made when the crypto market sat at $300 billion and Autonomous wanted to sanity check how much more exponential growth there was to load. The first step was to disambiguate stocks (or levels of value) from flows (or changes in value) and thus to separate discussion of revenue or transaction volume in a network from its valuation. Such argument is largely behind us. However, this analysis continues to ring true as the total crypto market cap fluctuates between $1 and $2 trillion in value (Figure 7 ). If the market value of all gold is about $10 trillion, give or take a few, then a 5x or 10x run in Bitcoin requires only its self-fulfilling prophecy to come to fruition.
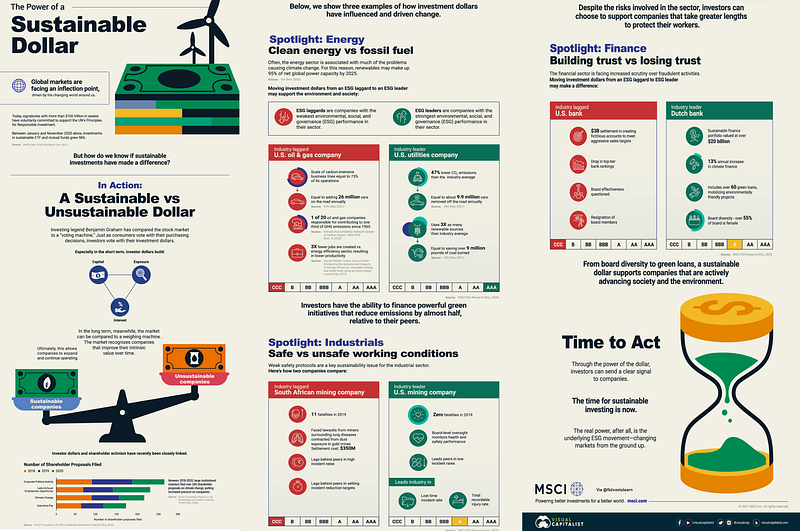
The Power of a Sustainable Dollar
Between January and November 2020 alone, investments in sustainable ETF and mutual funds grew 96%. The UN Principles of Responsible Investment now has over 3,000 signatories representing over $100 trillion in assets. The U.S. Commodity Futures Trading Commission established a Climate Risk Unit to analyze climate risk across derivative markets, and as of March 2021, new sustainability disclosures have come into effect in Europe. But how do we know if sustainable investments have made a difference? To answer this question, the above infographic (Figure 8) from MSCI examines the effect of a sustainable investment dollar by looking at real-world examples.
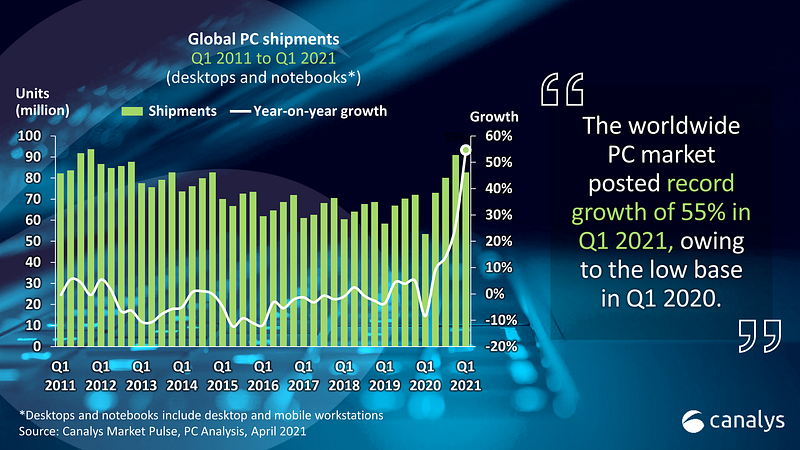
Global PC Market Posts Record Growth
The introduction of Windows 11 comes at an opportune time for Microsoft. Global PC sales soared during the COVID-19 pandemic as lockdowns forced work and school to go online, and so did the demand for Windows software pre-installed in consumer machines (Figure 9). Windows is by far the most popular operating system in the world, used on more than 1.3 billion devices.
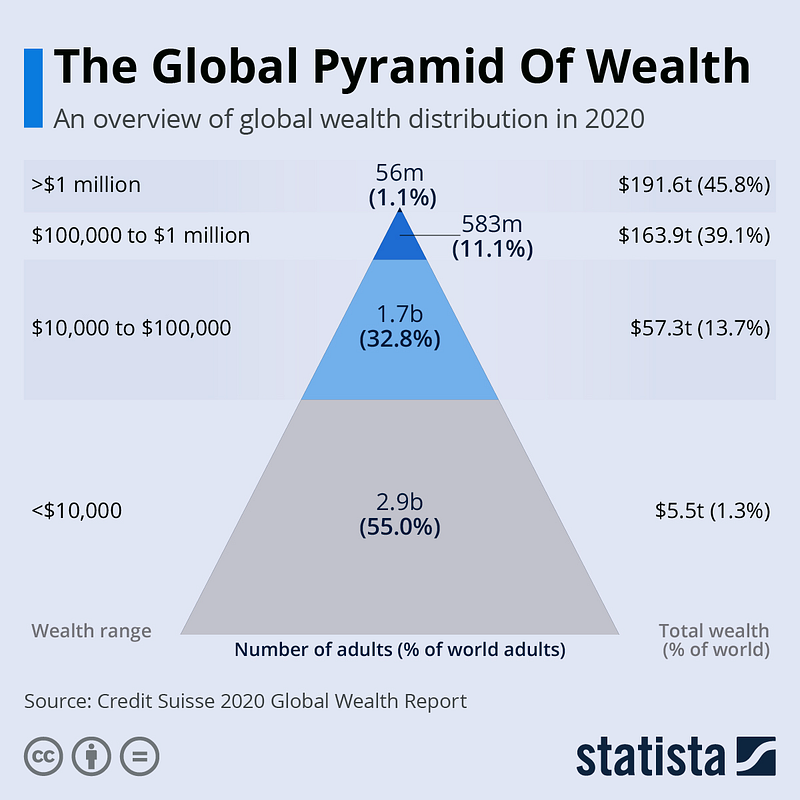
Global Pyramid of Wealth
The level of financial inequality around the world is staggering. According to a new Credit Suisse report, 45.8% of global household wealth is in the hands of just 1.1% of the world’s population (Figure 10). Those 56 million individuals control a mind-boggling $191.6 trillion, as can be seen on the following pyramid. Below that, 583 million people own $163.9 trillion, 39.1% of global wealth, despite accounting for just 11.1% of the adult population. The base of the pyramid is the most poignant and it shows how 2.9 billion people (55% of the world’s population) share a combined wealth of $5.5 trillion which is just 1.3% of total wealth.
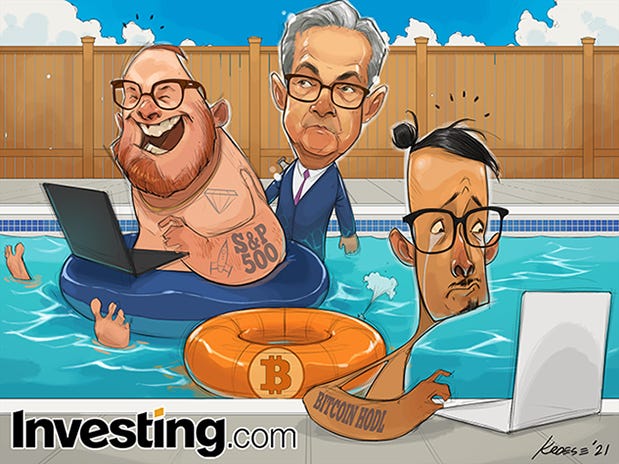
Market Humor: Summer at Financial Markets
Previous Edition of GBW
