
WEEKLY BUSINESS ROUNDUP
Global Business Week: RCEP is all set to become the World’s biggest trading block
The state of Financial markets & Economies, Weekly Charts, Business Trends & Statistics
Stocks fell for a fourth straight day in the U.S markets, with the benchmark S&P 500 index finishing its worst week since February. Similarly, Dow had its worst weekly decline since October, down 3.5% following Friday’s more than 500 point loss. Selling pressure in the Equities got magnified by investors worried over more signs that borrowing costs could be going up sooner than expected. This could eventually lead to the stifling of economic growth as the central bank tries to fend off higher inflation by raising interest rates.
The drop in equities was broad-based, with shares of industrial, energy, consumer, and financial companies falling. Chevron and Goldman Sachs lost more than 3%. All the stocks in the DJIA declined. Even tech stocks, which have been back in favor recently, were down. Sectors that had led the market higher all year were the week’s worst performers, with the financials and materials groups each losing more than 6% and energy losing more than 5%. Commodity prices also plunged, including a 9% drop in copper.
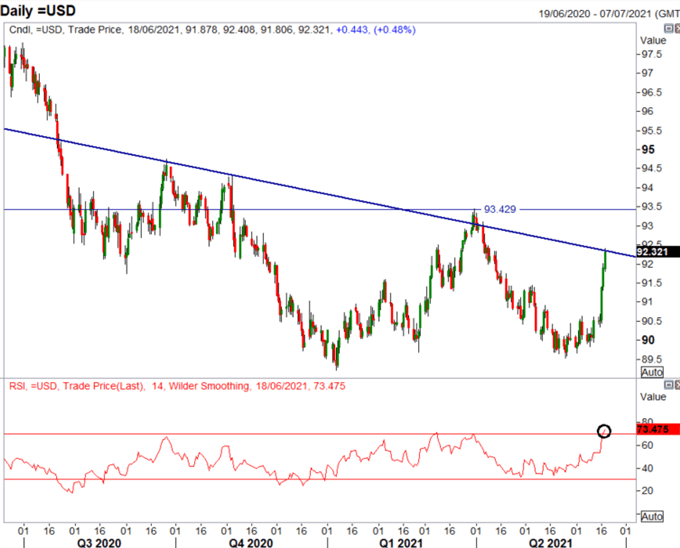
Greenback was the big gainer this week with a hawkish Federal Reserve lifting the benchmark Dollar Index (DXY) to new highs over 92.30. With the Feds dot plots much more hawkish relative to expectations, USD bears have been squeezed as dollar-funded carry trades unwind. However, given the size of the move in short order, the greenback is starting to look overextended. Looking ahead, upside risks likely to persist for the greenback vs low-yielding currencies as markets digest the Feds’ hawkish surprise. If the equities extend losses in what is typically a seasonally weak time for risk assets — this could give further impetus to DXY.
Although crypto market action was mostly a miss this week as Bitcoin & other cryptos lost ground, increasing indications are that Cryptocurrencies are more and more becoming a mainstream investment option. A new study by the U.K.’s financial services industry regulator, the Financial Conduct Authority (FCA) found that about 2.3 million adults in Britain owned cryptocurrency, a 21% increase from last year. The study reported that, on average, crypto owners were male, over 35 years old, with an occupation that put them in the upper or middle class, Similarly, Gemini also discovered average U.S. crypto investors were quite similar to their British counterparts: male, 38 years old, with an income of $111,000 a year.
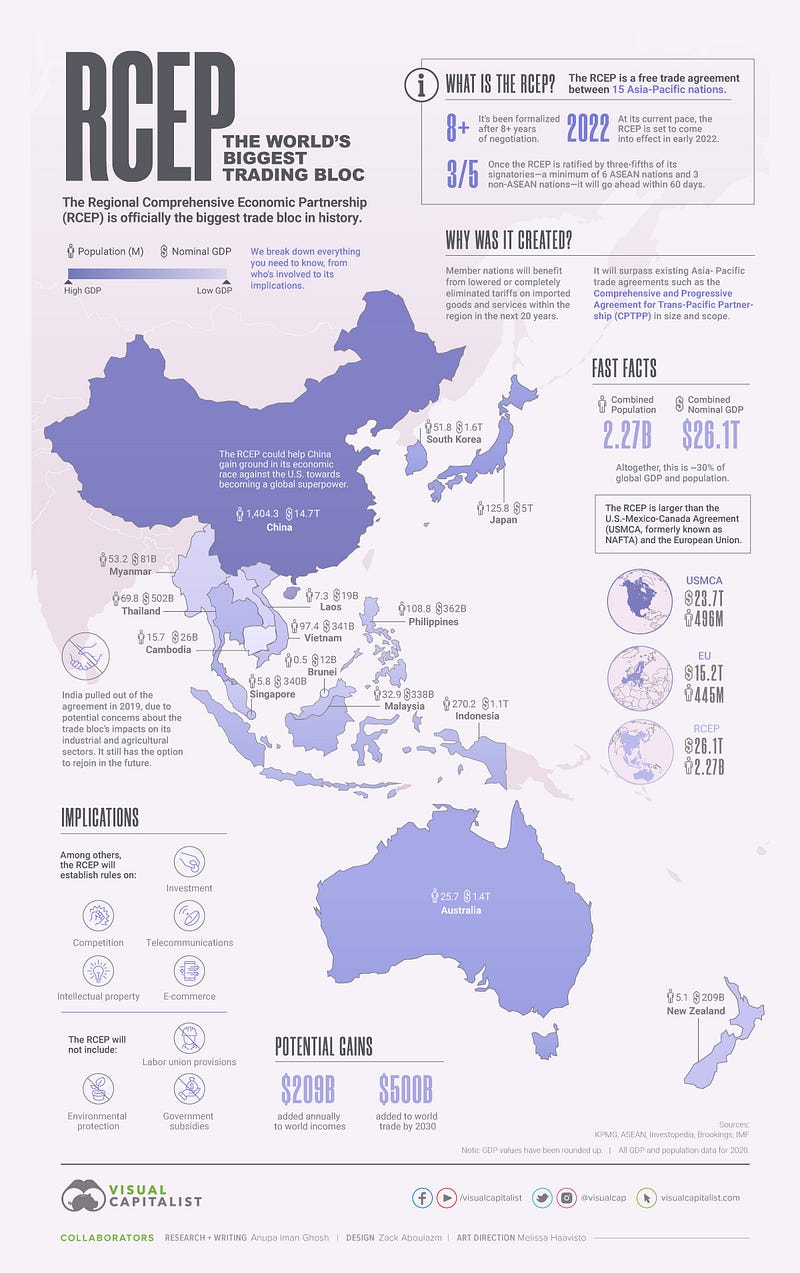
Today’s featured infographic looks at a new trade alliance taking shape in Asia & Oceania. USMCA & EU are two of the biggest trading regions in the world, but a novel trading partnership is all set to become the biggest trading block in the world. In late 2020, the Regional Comprehensive Economic Partnership (RCEP) was signed, officially creating the biggest trade bloc in history. The infographic above by Visual Capitalist breaks down everything you need to know about it, from who’s involved to its implications. The RCEP is a free trade agreement between 15 nations in the Asia-Pacific region and has been formalized after 28 rounds of discussion over eight years.
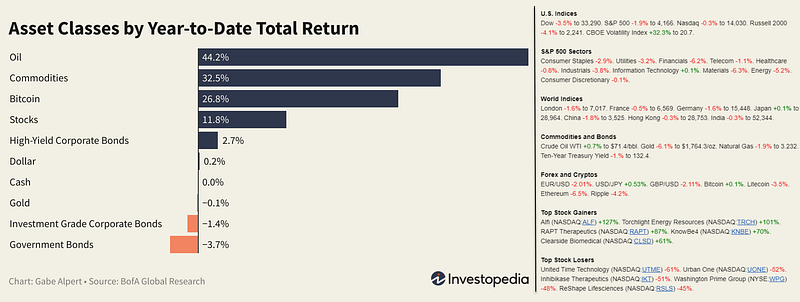
And finally, before moving on to some other statistics, here are the weekly & YTD numbers from various markets and different assets (Figure 1).
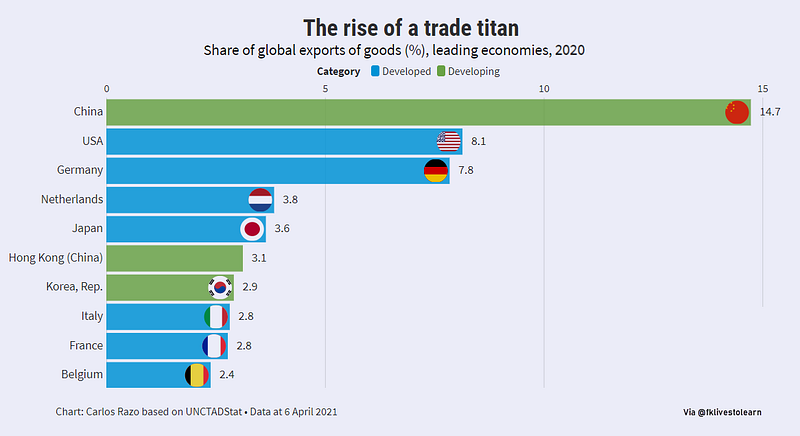
Global Trading Titans
And staying on the topic of global trade, not only does China have the second-highest GDP in the world, it exports 15% of all the world’s goods — by far the highest of any country (Figure 2). And the country is not slowing down any time soon. Further plans for economic development are well underway, like Made in China 2025, with the goal of becoming a dominant player in global high-tech manufacturing. Only the U.S. and Germany come close to its share of global exports, sitting at 8.1% and 7.8% respectively.
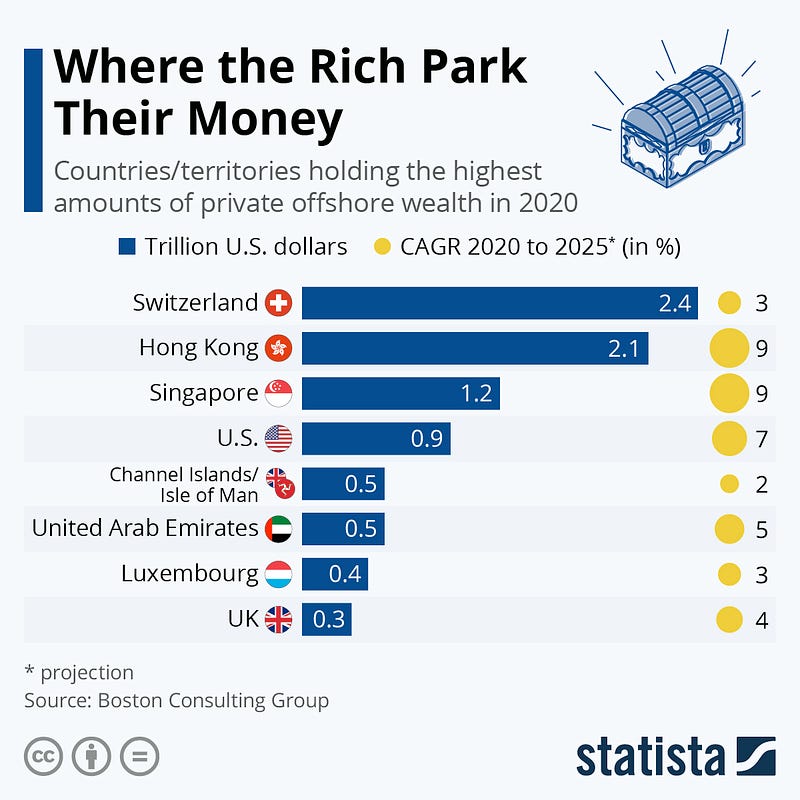
Safe Havens for the Ultra-Rich
Switzerland is still the prime destination for private offshore wealth worldwide. According to the Boston Consulting Group, foreign private wealth parked in the Alpine republic reached 2.4 trillion dollars in 2020 — a quarter of the global total. The biggest growth, however, was expected in Hong Kong and Singapore — the top 2 and 3 on the list (Figure 3), due to wealth created in Mainland China. Private offshore wealth or cross-border wealth also accumulated in tax-friendly entities like the UK’s Channel Islands & the Isle of Man, as well as the United Arab Emirates and Luxembourg. The U.S. and the UK appeared at №4 & №8 respectively.
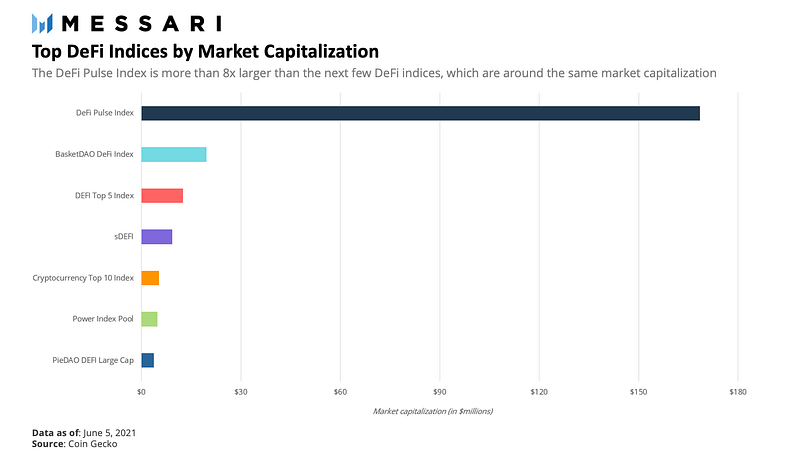
Top DeFi Indices by Market Cap
One of the most prominent projects to capitalize on the booming DeFi demand was Index Cooperative (Index Co-Op) with the launch of the DeFi Pulse Index ($DPI). Partnering with the popular analytics provider, DeFi Pulse, and the ERC-20 token bundling project, Set Protocol, this index was among the first of its kind to track the performance of blue-chip DeFi protocols and provide investor’s broad DeFi exposure in a single asset. In the months since its launch, DeFi Pulse Index has continued to be the leader among DeFi indices (Figure 4). It is significantly larger and enjoys higher liquidity across decentralized exchanges compared to its competitors.
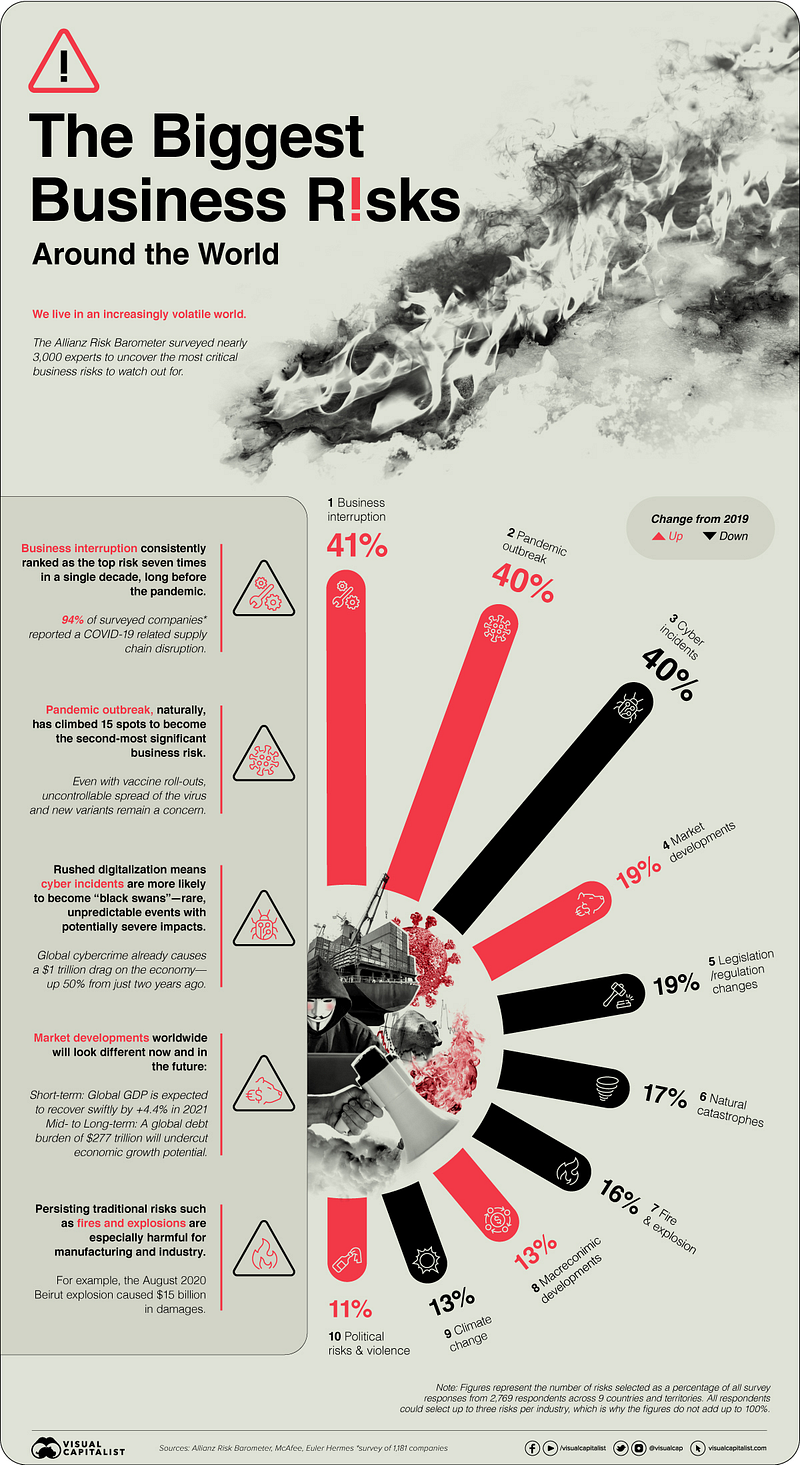
Biggest Business Risks Globally
We live in an increasingly volatile world, where change is the only constant. Businesses, too, face rapidly changing environments and associated risks that they need to adapt to — or risk falling behind. These can range from supply chain issues due to shipping blockages, to disruptions from natural catastrophes. As countries and companies continue to grapple with the effects of the pandemic, nearly 3,000 risk management experts were surveyed for the Allianz Risk Barometer, uncovering the top 10 business risks that leaders must watch out for in 2021 (Figure 5).
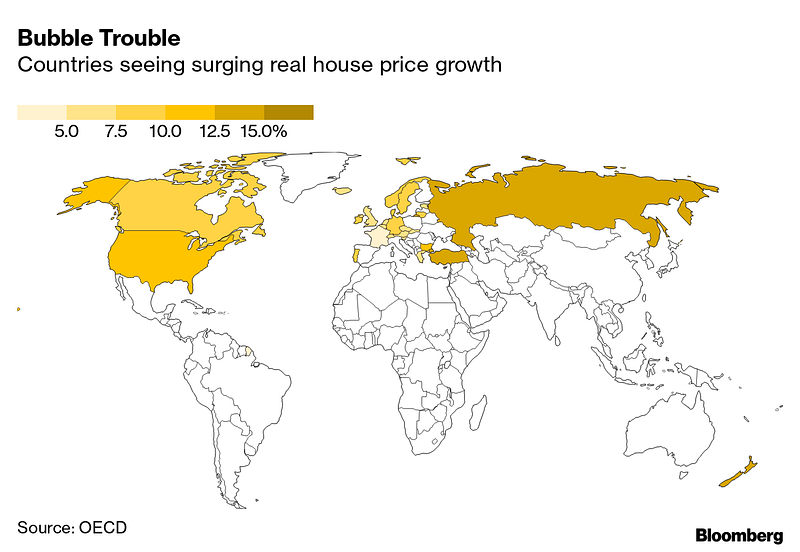
Housing Bubbles Around the World
Warning signs are emerging that the housing bubble may be ready to burst. New Zealand, Canada, and Sweden rank as the world’s frothiest housing markets, according to Bloomberg Economics (Figure 6). As people everywhere scramble for more space in the post-pandemic world, another trend is emerging in America: a rush for vacation homes.
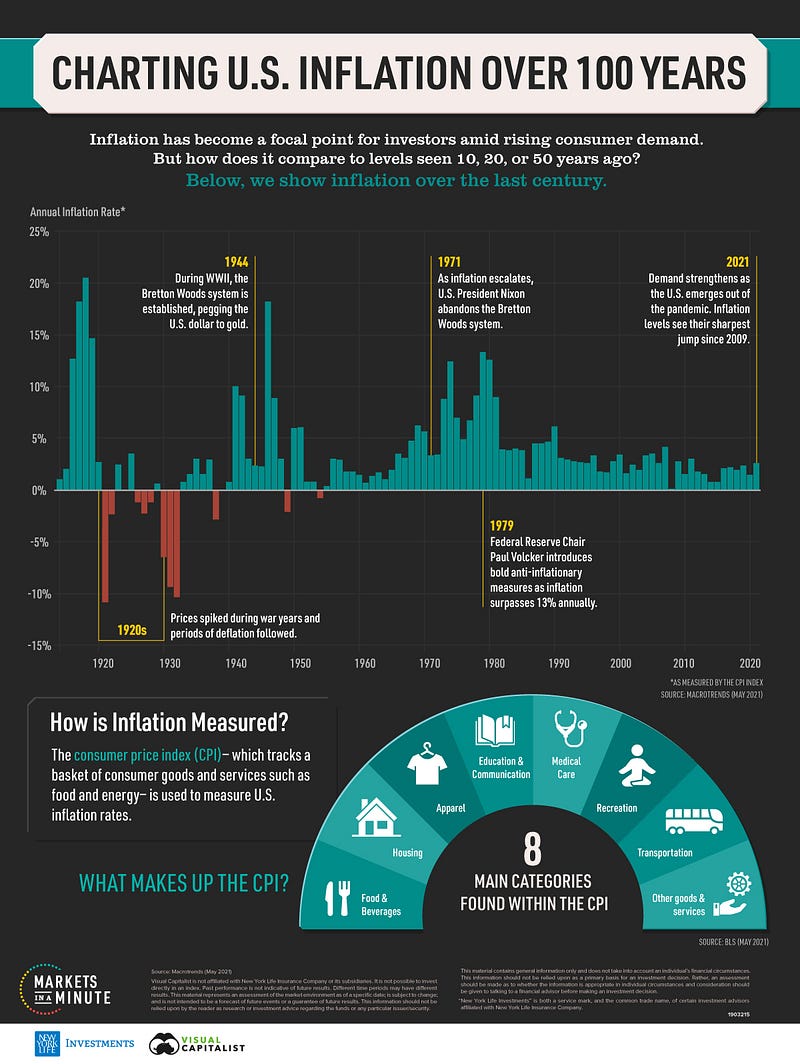
Charting U.S Inflation over 100 Years
The consumer price index (CPI), an index used as a proxy for inflation in consumer prices, offers some answers. In 2020, inflation dropped to 1.4%, the lowest rate since 2015. By comparison, U.S inflation sits at around 2.5% as of June 2021. For context, recent numbers are just above rates seen in 2019, which were 2.3%. Given how the economic shock of COVID-19 depressed prices, rising price levels make sense. However, other variables, such as a growing money supply and rising raw materials costs, could factor into rising inflation. To show current price levels in context, this Markets in a Minute chart (Figure 7) from New York Life Investments shows the history of inflation over 100 years.
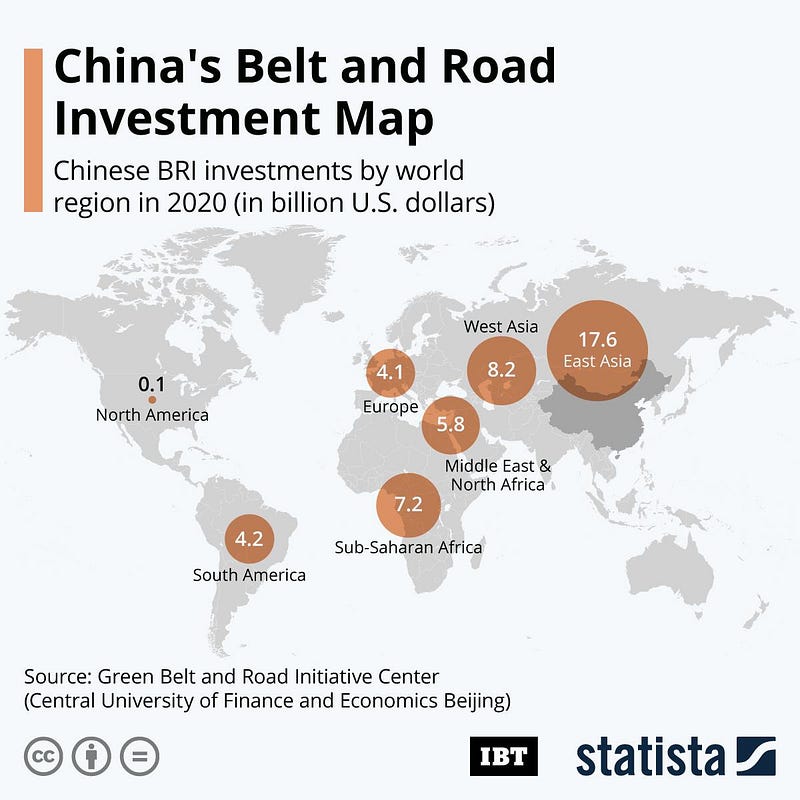
China’s Investment in Belt & Road Initiative
At the G7 summit in Cornwall last week, the members adopted a new global infrastructure investment plan to counter China’s infamous Belt and Road initiative. The plan has a focus on climate-friendly investments, but that doesn’t put the Build Back Better World Partnership ahead of China either. According to the Financial Times, China invested more in renewable energy through Belt and Road than in traditional energy sources in 2020 for the first time. Almost 60% or $11 billion of the energy investment budget went towards green energy. Energy investment is the biggest item in China’s BRI budget, making up $20 billion in 2020 (Figure 8), followed by transport at $14.6 billion. In line with China’s strategy of dual fossil and renewable energy growth, investment in coal nevertheless increased to 27% of the energy budget in 2020 — up from 15% in 2018.
Market Humor: Fed’s Tapering of Stimulus
Previous Edition of GBW
