
WEEKLY BUSINESS ROUNDUP
Global Business Week: Who services who in the Crypto custody business?
The state of Financial markets & Economies, Weekly Charts, Business Trends & Statistics
Investors shrugged off the report showing that U.S inflation could rise 5% — its fastest rate since 2008. U.S stocks overcame earlier losses on Friday to pick up steam towards the close, with S&P 500 barely notching a new record high. The bigger story, however, was that Nasdaq continued to outperform, rising nearly 2% on the week, making it four straight weeks of gains for that index. U.S. Treasury yields had their worst week of declines in a year, which may have something to do with these new record highs we are finally seeing in the S&P 500.
Despite this optimism in stocks, money flows into stocks have slowed down significantly since their record highs earlier in the year. According to BofA Research, only $1.5 billion flowed into global equities in the past week, the lowest all year, while $12.5 billion flowed into bonds and $3.5 billion went into cash and money markets. And it seems that the rotation from growth and stay-at-home stocks to value seems to have reversed in the past few weeks, as tech benchmark index Nasdaq, continues to outperform the other two major indices.
On the forex front, the DXY Index managed to gain +0.42% over the past five days, its best weekly performance since the last week of April. But if the inflation does provide transitory and risk appetite in stocks continues to escalate, it might be difficult for the benchmark dollar index to hold onto gains. With the Federal Reserve’s June policy meeting this week, the US Dollar is very much in the crosshairs.
The U.S. Dollar Index has been quietly staging a trend reversal over the past two weeks. DXY has broken through the downward trendline and has since found support and made a short-term high after today’s trading. Closing the week at 90.51, it has a mixed bias heading through the middle of June.
Similar to U.S stocks, another interesting rotation seems to be playing out in Bitcoin, associated cryptocurrencies & the rising interest in Cybersecurity. A spate of cyberattacks, which were settled in digital ransom payments eventually may have chipped away at the trust investors had bestowed upon the digital assets. Especially, when it came to light that U.S investigators were able to recover most of the Bitcoin ransom paid to Colonial pipeline attackers. The extremely tight range bearish consolidation persists in Bitcoin, as it makes lower highs — trading close to $35k at the time of writing.
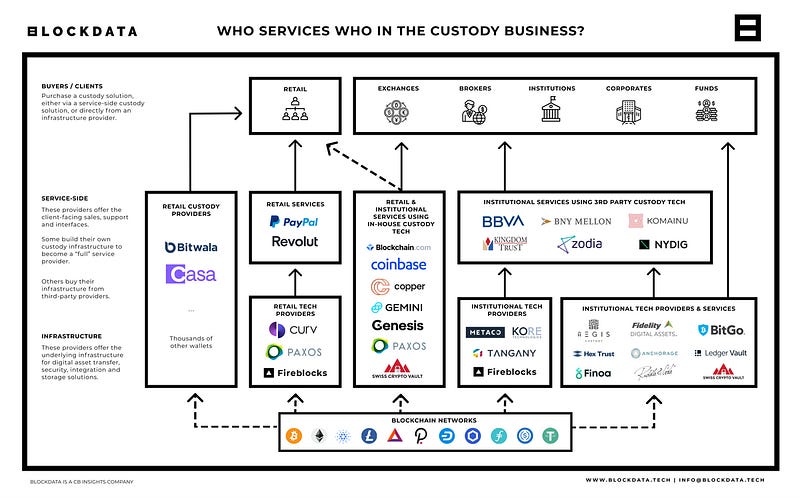
Today’s featured infographic from Blockdata features how the business of crypto custody solution works. Looking at the visual above, it shows what the complete custody business looks like at a high level. The companies listed in each section are not exhaustive and were selected to give us some examples. If you are interested in exploring more providers for a specific section, check out their custody solution providers page.
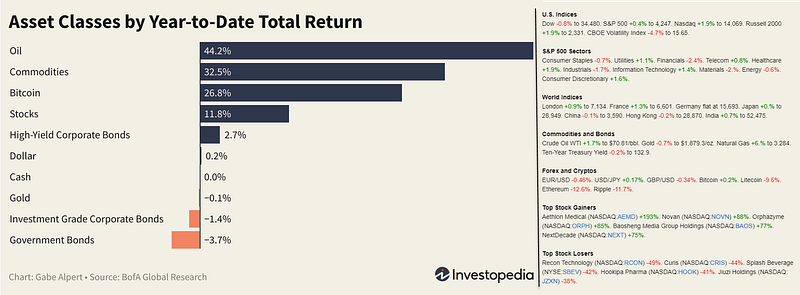
And finally, before moving on to some other statistics, here are the weekly & YTD numbers from various markets and different assets (Figure 1).
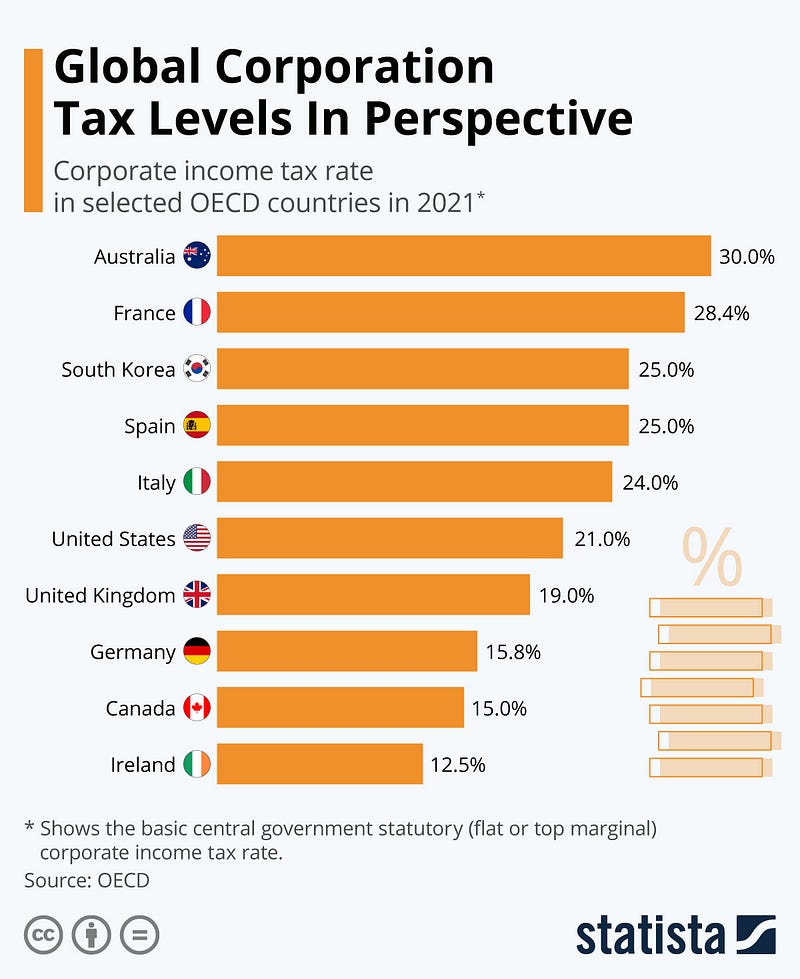
Global Corporation Tax Levels
Big global corporations avoiding taxes by registering in tax haven jurisdictions have added urgency to the G7 negotiations and the deal is agreed upon whereby companies must pay a minimum 15% rate regardless of where their headquarters is located. It will also aim to close loopholes and force some of the largest multinationals and tech giants such as Amazon and Microsoft, to pay taxes where they sell their goods and services, regardless of whether they are physically present in certain countries. The OECD estimates (Figure 2) that the proposals could generate up to $80 billion in additional tax revenue a year, though the final figure will depend on the finer points of the agreement.
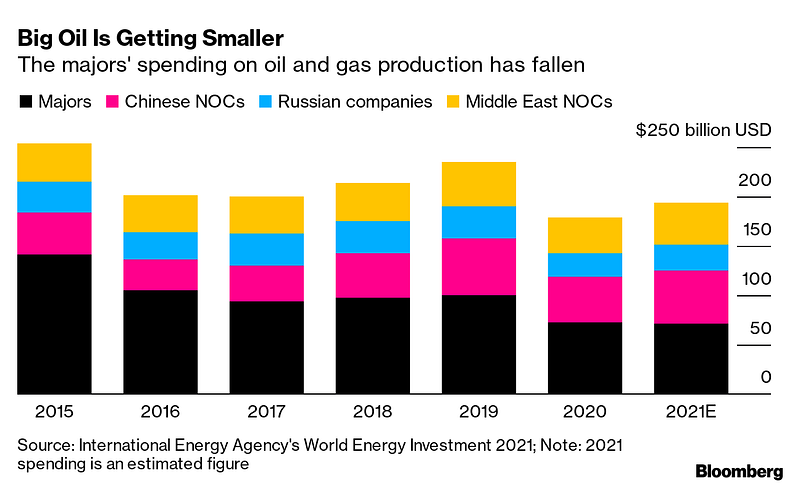
Big Oil is Getting Smaller
Most of the major private Oil companies like Exxon are under pressure, as investors align their values to a more sustainable future (Figure 3). ESG proponents getting seats on the Board of Directors of these companies is a testament to that fact, but any whisper of a looming demise for fossil fuels would be premature. Oil companies owned by governments (National Oil Companies) don’t have the same concerns as the private sector, and they’re not going anywhere…. at least in very the near future.
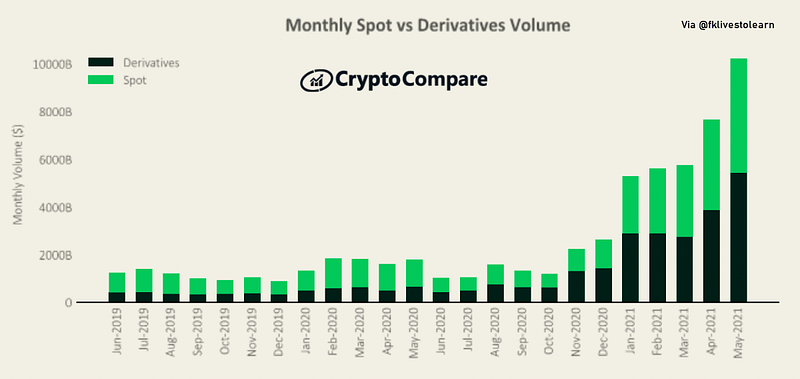
Crypto Derivatives Volume Surges
Total derivatives volume increased to $5.5 trillion (up 40.4%), as investors reacted to higher volatility. The top 3 exchanges, Binance, OKEx, and Bybit, saw monthly trading volumes of $2.5 trillion (up 48.9%), $999 billion (up 50.8%) and $574 billion (up 24.0%), respectively. The derivatives market now represents 53.3% of the total crypto market (vs 50.2% in April, Figure 4).
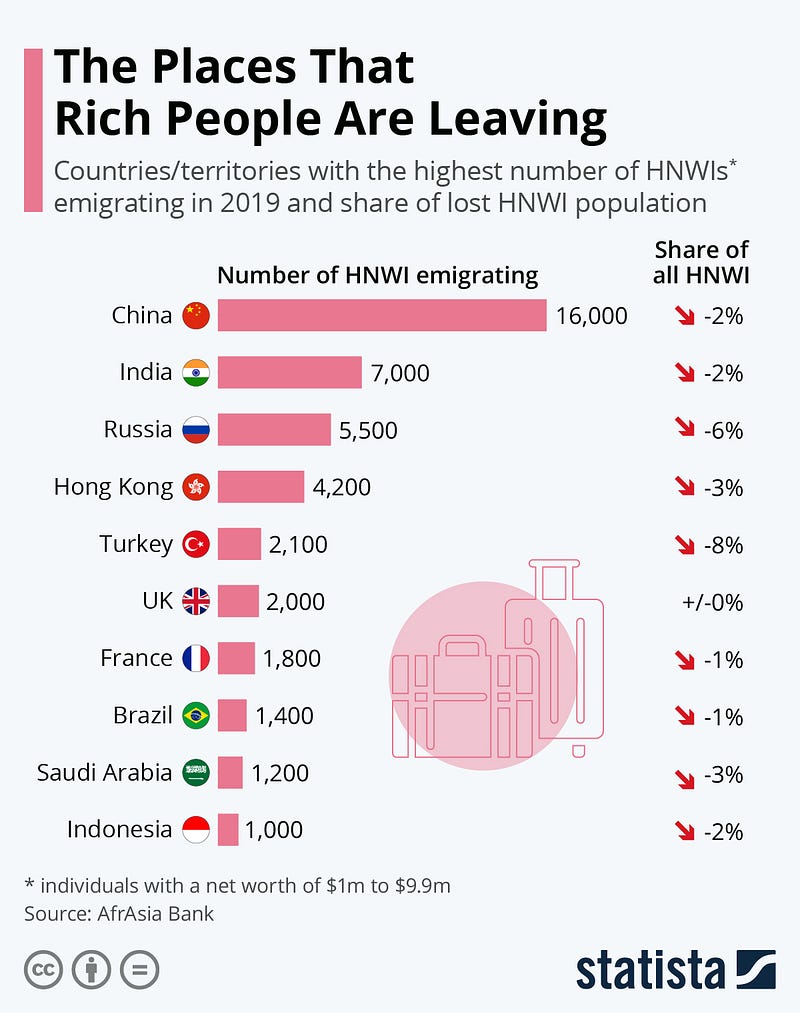
Exodus of the Ultra-Wealthy
Data shows that 16,000 Chinese and 7,000 Indian high net worth individuals moved out of their respective countries in 2019. The study by AfrAsia Bank covered only individuals with a net worth of $1 million to $9.9 million, who took up residency in a new country and spent at least half of the year there. While these millionaires for China and India constituted only a loss of 2% of their HNWI population, relative outflow from Russia and Turkey was higher at 6 and 8%, respectively (Figure 5).
According to the report, work opportunities, tax & financial concerns were among the reasons HNWI were deciding to make these moves. Australia topped the list of receiving countries, attracting 12,000 HNWI in 2019, which upped its HNWI count by 3%. The U.S. and Switzerland came in rank two and three, adding 10,800 and 4,000 HNWI. Portugal and Greece were also among the top 10 countries attracting HNWI.
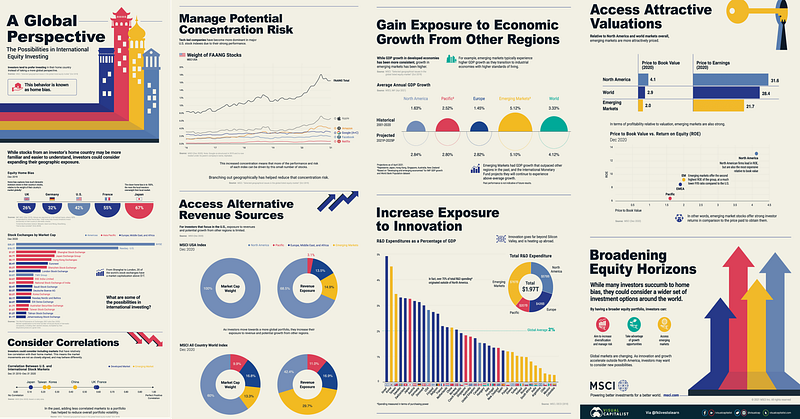
The Possibilities in International Equity Investing
When we are in our comfort zones, we are more likely to feel safe and familiar — and this same psychological effect is at play when we’re choosing where to invest. In fact, it’s widely understood that investors tend to prefer investing in their home country instead of taking a more global perspective, a behavior known as home bias. However, investors could consider expanding their geographic exposure. From Shanghai to London, 20 of the world’s stock exchanges have a market capitalization above $1 trillion. This infographic from MSCI highlights the possibilities in international equity investing. Let’s dive into some of the key concepts covered in the visualization (Figure 6).
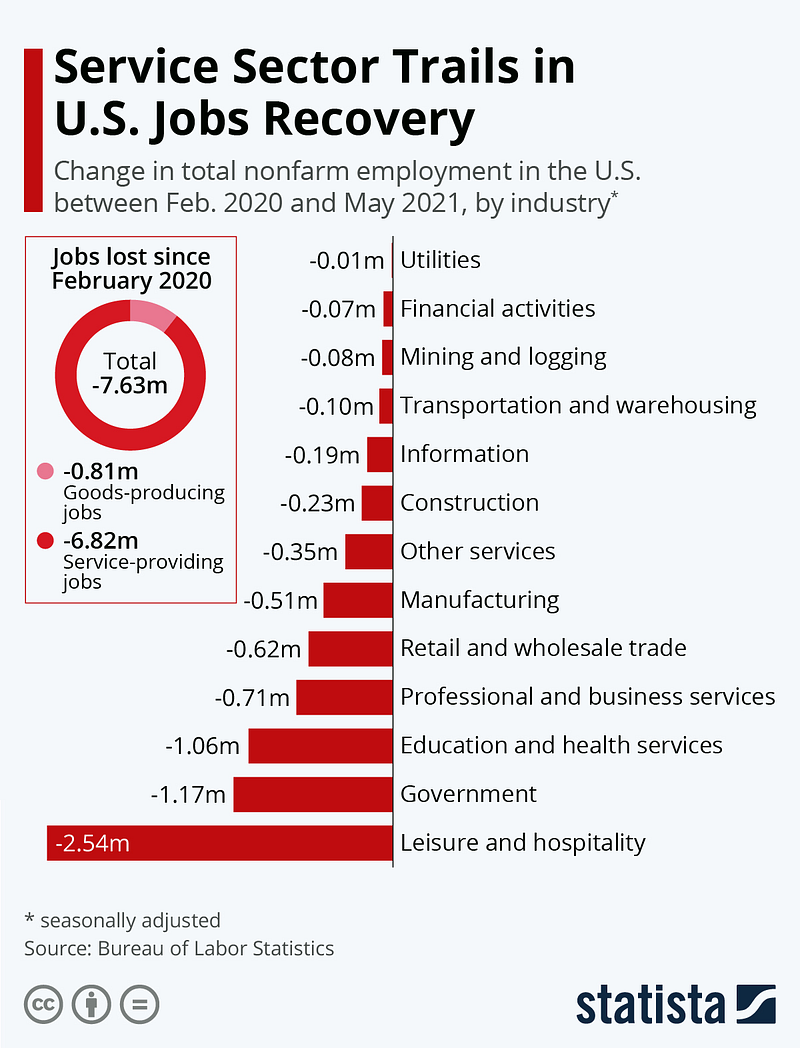
U.S Service Sector Jobs Recovery Trails
While some sectors recovered relatively quickly once restrictions had been eased and businesses were allowed to reopen in the summer in the U.S, we are now 15 months into the crisis and the U.S. labor market is still more than 7.5 million jobs short of its pre-pandemic level. As the following chart shows (Figure 7), the vast majority of those lost jobs are service-providing jobs, with the leisure and hospitality sector alone accounting for 2.5 million of the total 6.8 million lost service sector jobs. The picture might change as fully vaccinated people in the U.S rise and the economy reopens fully.
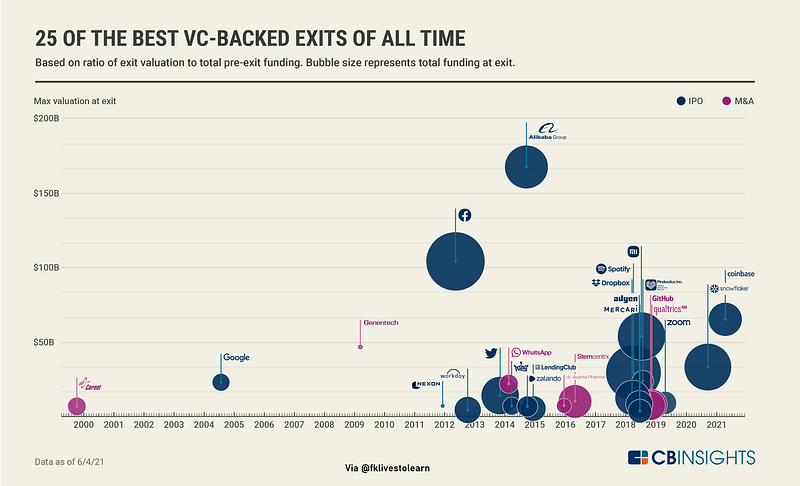
25 Best VC-backed Exits Ever
CB Insights analyzed 25 of the best VC-backed exits of all time to learn more about what those home runs have in common. To do so, they pulled data and information from web archives, books, S-1s, founder interviews, the CB Insights platform, and more. For each company, they dove into the remarkable numbers they posted before their IPOs and acquisitions, the driving factors behind their growth, and the roles of their most significant investors. Below, it shows you their analysis of each specific case. Here are the stories behind the best VC home runs of all time (Figure 8).
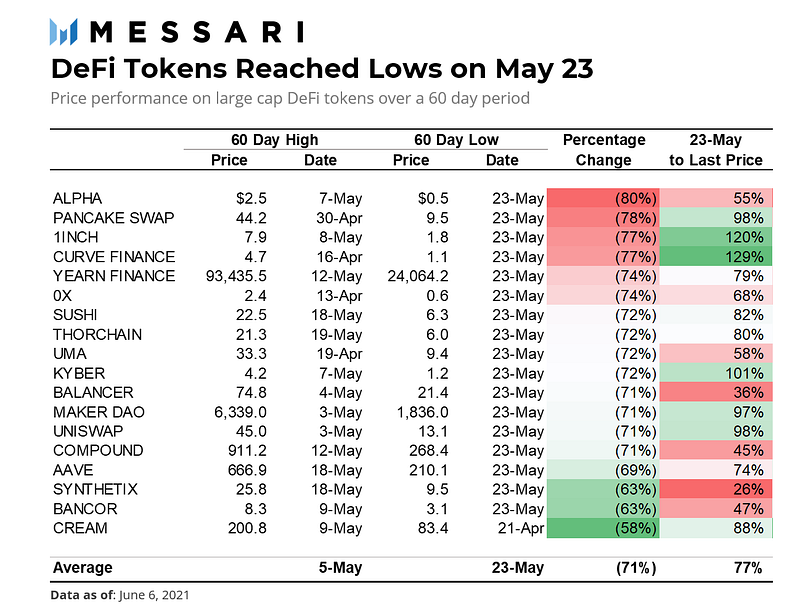
Price Performace of Large Cap DeFi Tokens
Below is the table of the price performance in the past 60 days. Most tokens reached their local highs (LHs) a few days before or after May 5th (the average of the group). The exceptions are SUSHI, RUNE, AAVE & SNX which reached highs after the selldown began around May 14th. The date for the 60-day low is more synchronized, occurring on May 23rd for the subset of major DeFi tokens below — where the average drawdown was -72%. In the 60-day period, PancakeSwap and 1INCH underperformed while Synthetix and Bancor outperformed.
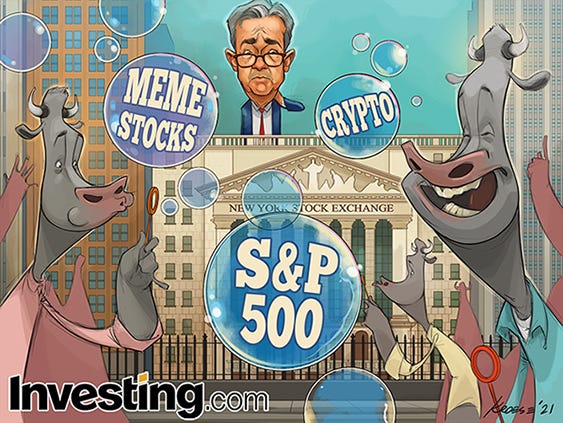
Market Humor: Feds and the Market Bubbles
Previous Edition of GBW
