
WEEKLY BUSINESS ROUNDUP
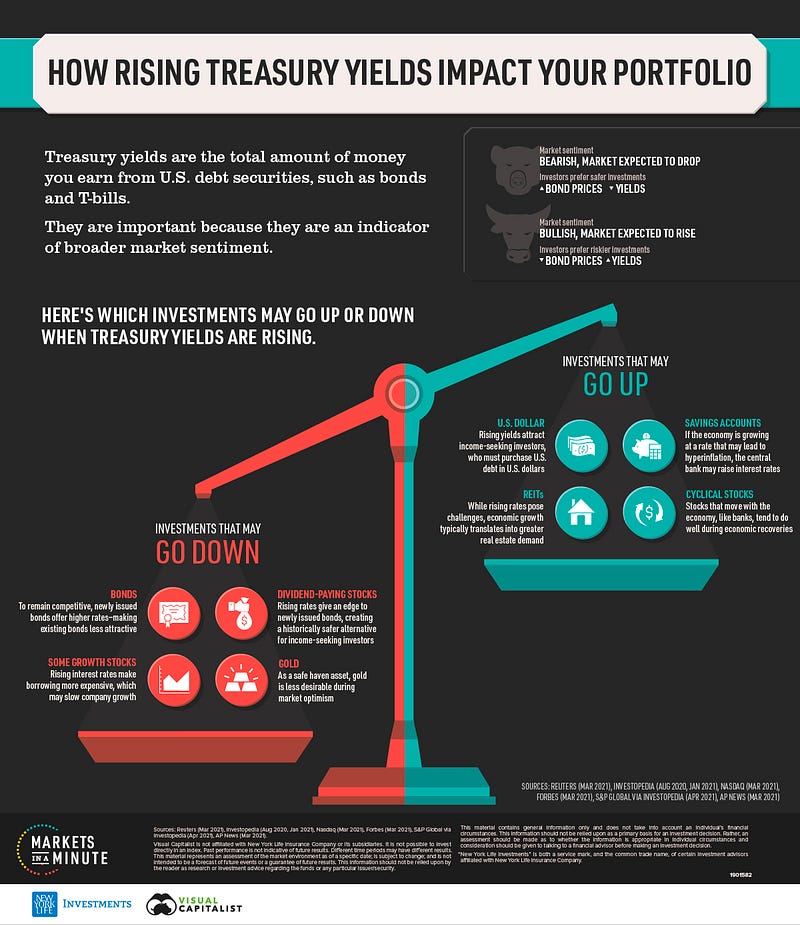
Global Business Week: How rising U.S Treasury yields impact your Portfolio?
The state of Financial markets & Economies, Weekly Charts, Business Trends & Statistics
Meme stocks continued their wild price swings on Friday, with AMC Entertainment falling 6.7% but still surging more than 80% for the week, while BlackBerry slipped 12.7% Friday to trim its weekly gain to 37%. Although the NFP headline number fell short of the expectations, with a strong 559k job additions — this not too hot not too cold growth was just right for investors who may feel that the Federal Reserve will be more measured in tapering its purchases of government bonds as the economy continues to strengthen.
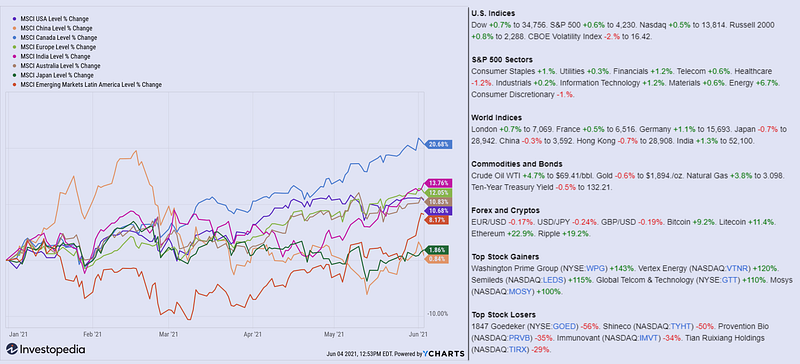
The yield on the 10-year U.S. Treasury is hovering around 1.5%, which indicates that while the economy is getting stronger, it’s not strong enough yet for the Fed to raise interest rates or stop its quantitative easing. Gold prices jumped 1% on the lukewarm jobs report. Among the major indices, Nasdaq led with a 1.5% gain on Friday, capping its third straight weekly gain. The Dow Jones and S&P 500 averages advanced 0.7% and 0.6%, respectively, for the week. The S&P 500 is less than 1% away from all-time highs.
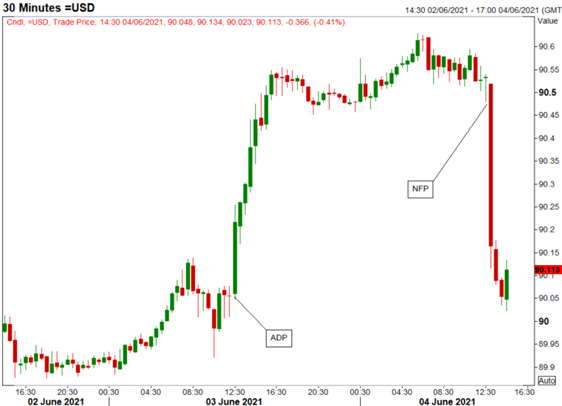
The dollar index (DXY) pretty much closed the week where it started after a merry go around this week. The post-ADP report euphoria in the Greenback transitioned to disappointment after the NFP release, as the reserve currency gave up all the gains. The report did, however, alleviate concerns from the pressure that the Fed may have to consider tapering sooner rather than later. Looking ahead to next week, much of the focus will be on Thursday’s lineup of key data events with both the ECB decision and US CPI report scheduled for release. DXY closed just above the important 90-handle.
Cryptocurrencies traded most of the week in a tight consolidative range — for Bitcoin, it meant staying between $33k-40k. Elon Musk was at it again with another controversial tweet in which he posted a heartbreak emoji mentioning the premier digital currency. BTC quickly lost ground by a few thousand dollars, and so did the rest of the bunch. Having said that, higher lows are still in place for BTC & ETH — the latter faring a little better with regards to recent losses. Overall, the bearish consolidation still persists as investors eagerly await the breakout from the current consolidation phase.
Today’s featured infographic (pictured above) of Markets in a Minute from New York Life Investments, explains why Treasury yields are important and which investments may go up or down when yields are rising. The yield on the U.S. 10-year Treasury note has climbed to pre-pandemic levels. But what exactly does this mean, and how could it impact your portfolio? Find the answers above.
And finally, before moving on to some other statistics, here are the weekly & YTD numbers from various markets and different assets (Figure 1).
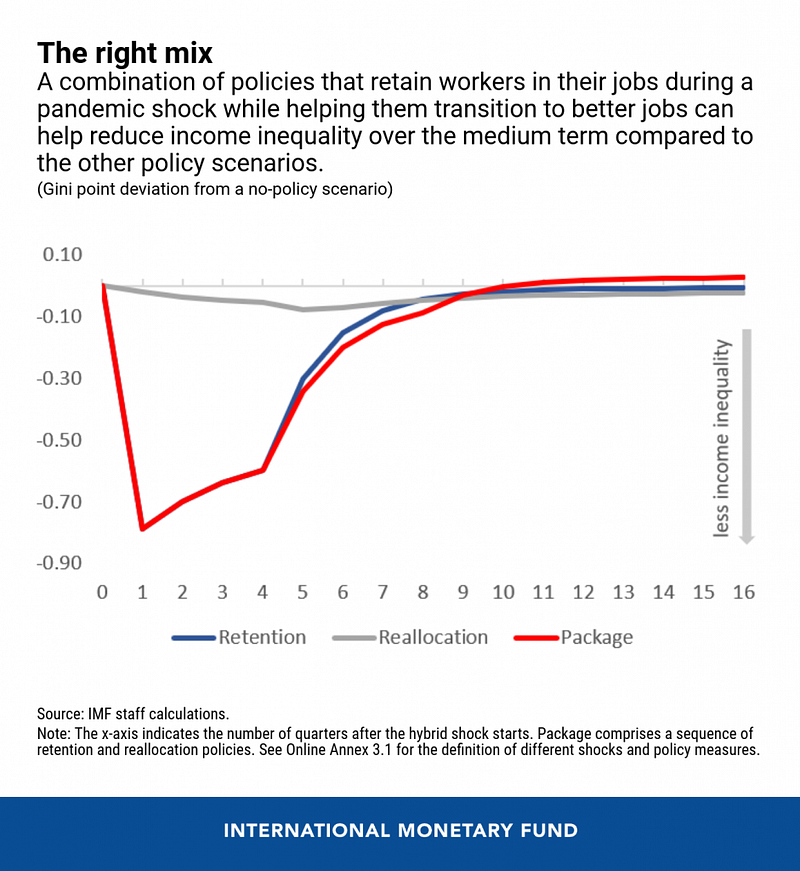
Reducing COVID-19’s Unequal Effects for Workers
As shown in IMF’s research from April 2021, World Economic Outlook finds that job retention support (shown by the blue line) can more quickly reduce the rise in income inequality in the first few months after a crisis hits (Figure 2). When followed with support for workers to shift or reallocate to new jobs, the analysis shows that the combined, well-sequenced policy package (shown by the red line) can more effectively dampen the increase in income inequality over the medium term, as captured by the lower Gini index (a common measure of income inequality) — than if each type of policy was used alone.
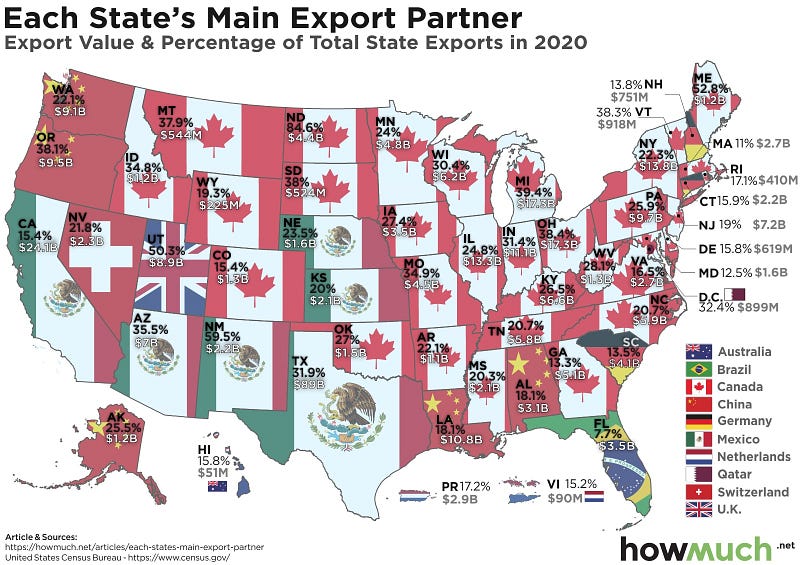
U.S States Main Export Partners
Data for the infographic by Howmuch.net below (Figure 3) was gathered from the U.S. Census Bureau, which highlights each state’s top export partner, together with a percentage of total state exports and the overall dollar figure. As evident Canada is the single biggest trading partner for the vast majority of states, receiving the most exports for 33 states. China is the largest trading partner for only 5 states, which includes Alaska. This is one sign of the large trade deficit between the U.S. and China. Most states have a balanced and diversified number of international trade partners, with the average across all states coming in at 26.4%.
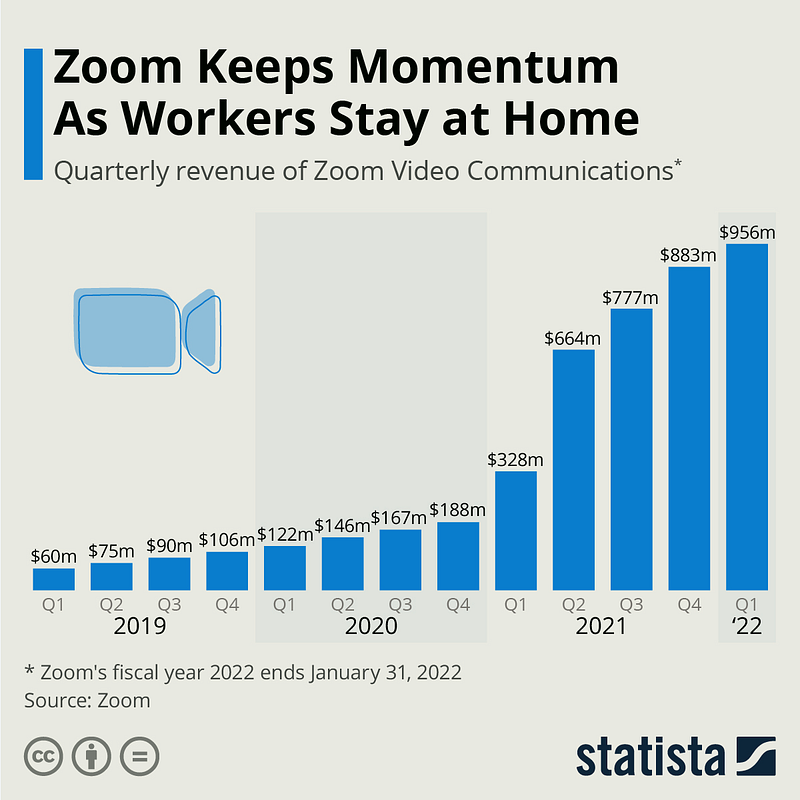
Zoom Maintains Revenue Momentum
Zoom Video Communications has been a major beneficiary of the changes brought about by the COVID-19 pandemic. As much of the world has been working and studying from home and relying on technology to stay in touch with colleagues and loved ones amid national lockdowns, video conferencing apps saw an unprecedented surge in usage, with Zoom one of the most popular options available. For the three months ended January 31, Zoom posted yet another revenue record, subsequently raising its revenue guidance for fiscal 2022 to between $3.975 billion and $3.990 billion (Figure 4).
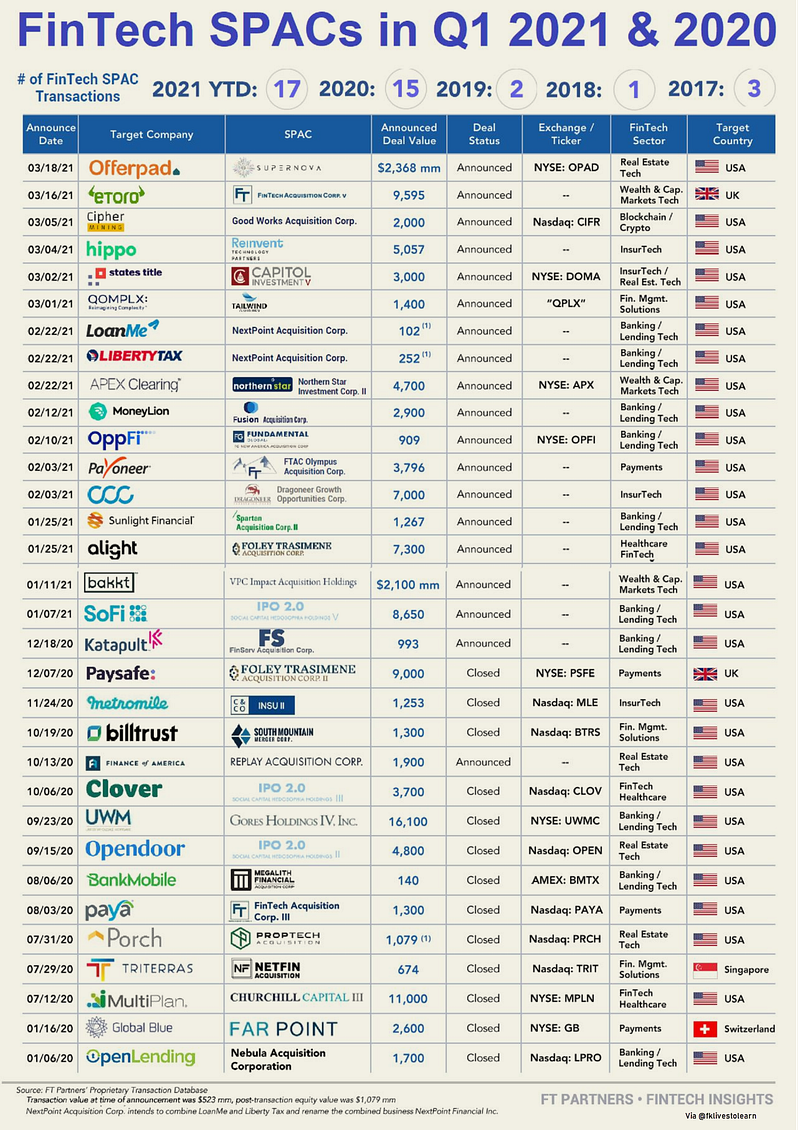
FinTech SPACs Blooming in 2021
The SPAC markets are flipping fintech companies from private to public. The list of those companies is growing, and growing, and growing. Anything generating $50 to $500 million in revenue and with 500,000 to 10 million users is finally going public. As it should, if the public markets weren’t a wall of compliance. As is the case, the first 3 months alone have seen 17 such deals, overtaking a total of 15 deals in the whole of 2020 (Figure 5).
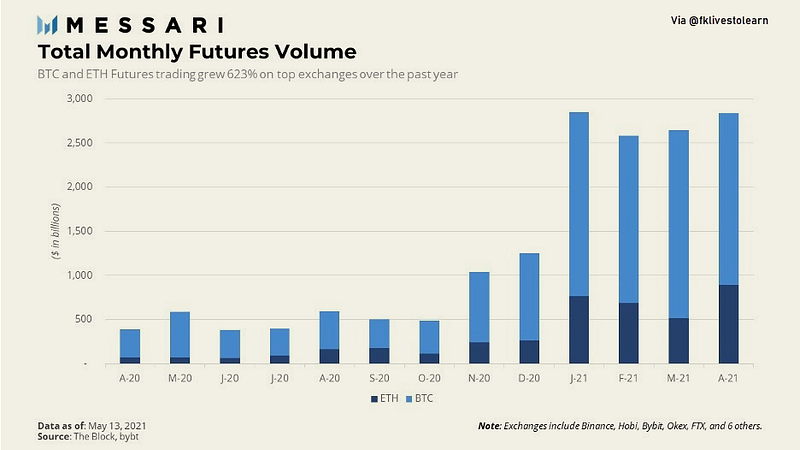
Massive Growth in the Digital Asset Futures Market
The digital asset futures market grew exponentially over the last year. Most crypto exchanges are centralized like traditional financial institutions. Despite unavailability in several countries, monthly BTC and ETH trading volume alone exceeded $2 trillion in 2021 (Figure 6). The last twelve months saw the market grow over 600%. Volume growth at that level obscures the fact that digital derivatives are still not universally available. Decentralized platforms can still take a share of a growing market fueled by traders seeking an edge.
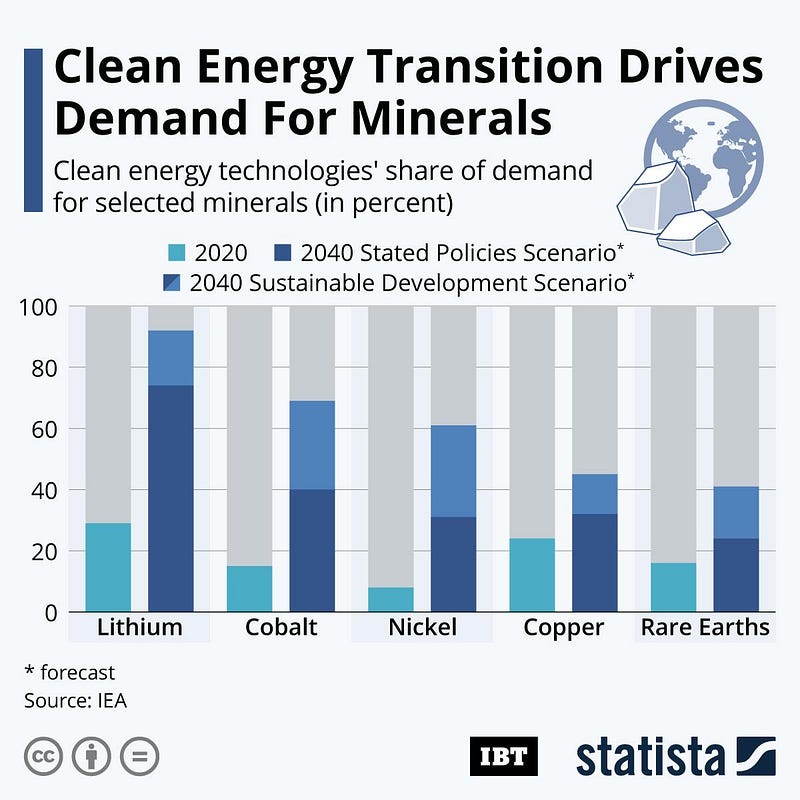
Clean Energy Drives Demand for Minerals
According to a new report put out by the International Energy Agency, the demand for some minerals will skyrocket by 2040 as the world transitions towards clean energy technologies (Figure 7). Lithium was the most affected, with clean energy technologies alone expected to fill up between 74 and 92% of global demand by 2040. Cobalt and nickel demand will be bracing for a similar scenario. Between 40 and 70% of extracted cobalt could go towards renewable energy goals in 2040, as could between 30 and 60% of nickel.
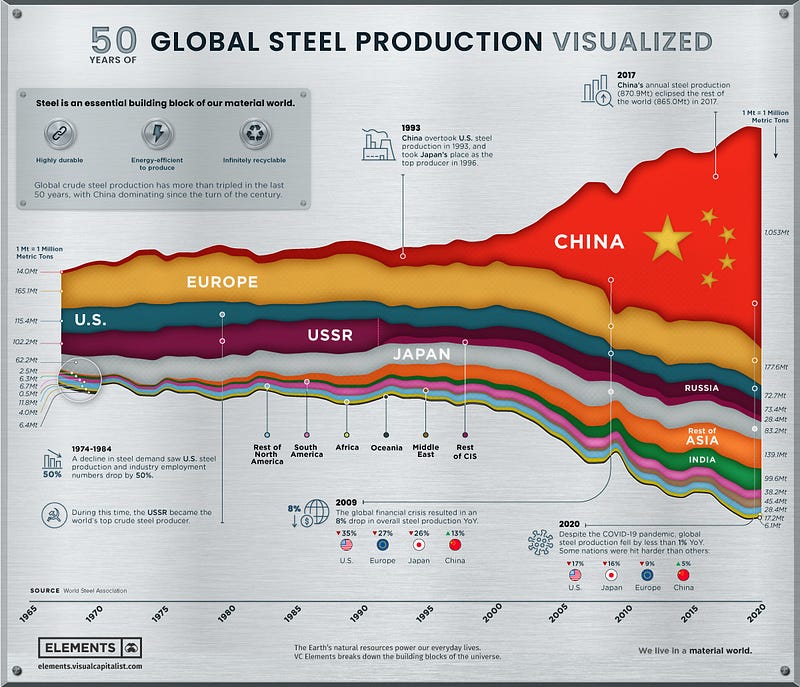
The Rise of the Steel Age
From the bronze age to the iron age, metals have defined eras of human history. If our current era had to be defined similarly, it would undoubtedly be known as the steel age — used as the foundation of our buildings, vehicles, and industries, with its rates of production and consumption often seen as markers for a nation’s development. Today, it is the world’s most commonly used metal and most recycled material, with 1,864 million metric tons of crude steel produced in 2020. The infographic below (Figure 8) uses data from the World Steel Association to visualize 50 years of crude steel production, showcasing our world’s unrelenting creation of this essential material. China is the most dominating player in steel production.
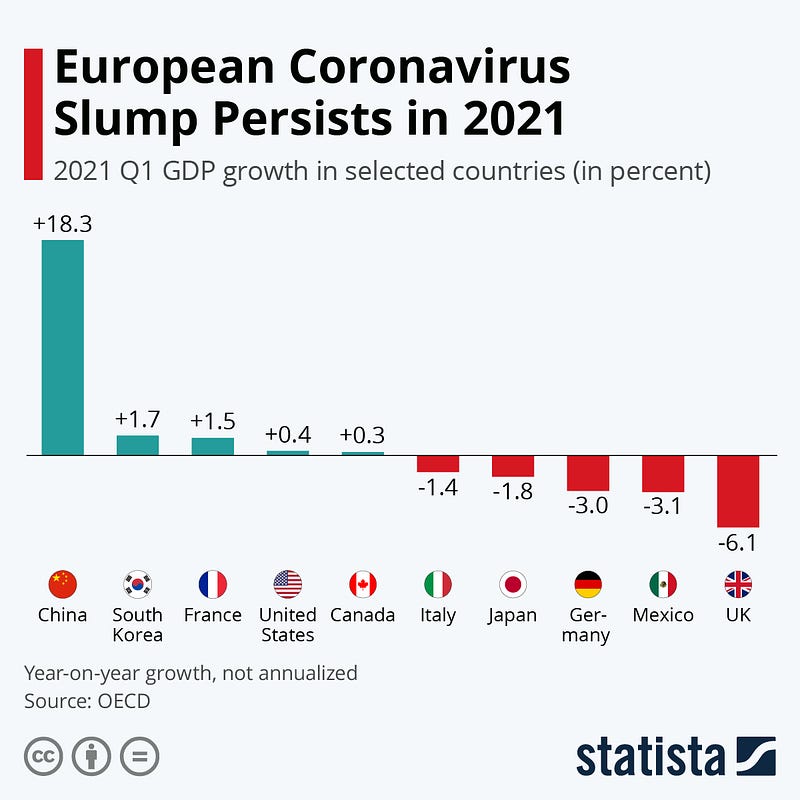
Europe’s COVID Economic Slump Persists
GDP figures by the OECD for the first quarter of 2021 show the ongoing impact the coronavirus is having on economies around the world. China was the first economy that bounced back from its coronavirus losses. The country recorded a GDP growth of 3.2% as early as Q2 of 2020 and most recently even grew its economy by 18.3% compared with Q1 of 2020. 2020’s first quarter was the only one in which China’s economy shrank due to the coronavirus pandemic. Most other economies did not see negative GDP growth until Q2 of 2020, so this phenomenon has not occurred for them yet.
In Q4, Turkey and India had already joined China as countries whose quarterly GDP was growing again in year-over-year terms. In Q1 of 2021, South Korea, the U.S., Canada and France also joined that list of countries. France was the exception to the rule in Europe (Figure 9), which largely carried on with coronavirus losses as second and third wave lockdowns continued on the continent in Q1. The UK was hit hardest, still losing more than 6% compared to the undisturbed quarter one year ago. Germany lost 3% compared to Q1 of 2020, while Italy could limit losses to 1.4%.
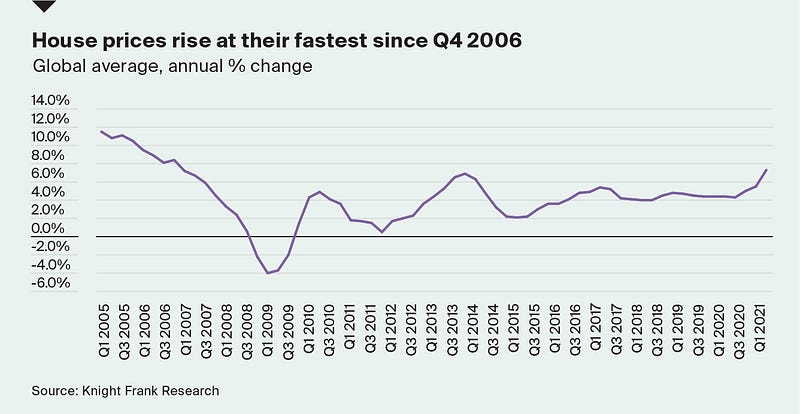
Global House Prices Rise
A new report from U.K. real estate consultant Knight Frank showed global housing prices rose in the first quarter at the fastest rate since the end of 2006. The organization’s Global House Price Index found on average the cost of a home increased 7.3% from the same period last year. Thirteen countries had double-digit percentage price growth. Turkey led the gains for the fifth-consecutive quarter, up 32%. It was followed by New Zealand, Luxembourg, and Slovakia. The U.S. was fifth, with a 13.2% rise, the largest in more than 15 years (Figure 10). Knight Frank pointed out the boom in prices is raising concerns about a housing bubble and said some governments such as China, Ireland, and New Zealand have taken action this year to cool the price hikes, with China even considering a national property tax. It added that Canada is looking at a national vacancy tax.
Market Humor: AMC leads the ‘Meme Stock’ Rally

Previous Edition of GBW
