
Generating Automated Headers In Looker For More Dynamic Reporting
In less than 10 minutes create a Looker header that dynamically displays attributes — like the current month — for your users.
Author’s note: In technical roles like data engineering, sometimes you come across problems so unique to your use case that solutions don’t yet exist. This was one of those problems. On behalf of my past self, I hope this is helpful for you.
Date time operations, despite being rooted in geographies hundreds of years old, continue to pose programmatic challenges across languages; I know this because at PyCon 23 I attended a 45-minute talk solely on time operations and timezone conversions.
And while I’ve written about challenges SQL users face when conducting date and time operations, I want to address a specific use case at a point I rarely speak about: The end of the pipeline. A.K.A. the visualization platform the data consumer uses to access reporting.
In this case, because I’m partial to a Google Cloud Platform-oriented stack, I’m talking about Looker. Instead of delving into nuanced calculations like UTC conversion or handling daylight savings time, I want to focus on one deceptively simple problem I recently encountered when creating a dash.
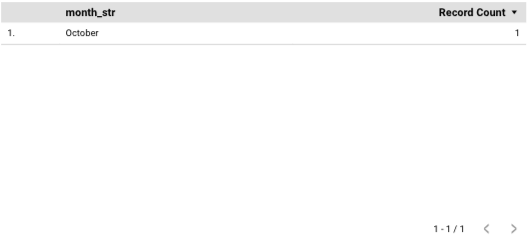
My question: How do I create a string representation of the current month above a monthly engagement report, like the below image?

The added challenge: How do I get that string representation to seamlessly and automatically change to the next month at the correct interval?
And, finally, how do I take a table (like the one below) and turn it into a clean, concise month?
I wish my thought process was as elegant as the above break down. Instead, like solving many data-oriented or software problems it involved a close reading of any available documentation, iteration and, in the end, good old trial and error.
Whether you’re attempting to create a month header or a similar dynamic string variable, my hope is that stepping through this process with me will help you better understand how to think not only about how to structure your data — but also about the experience of your end user.

Laying The Foundation: The Data
Since I’m a data engineer, I began the only way I know how: Developing a precise and clean dataset. In this case, the ideal output would be one row.
Thankfully, I was able to leverage BigQuery’s built-in date functions to jumpstart my attempts.
In order to get the current month, I need the current date.
SELECT CURRENT_DATE("America/New_York") AS report_date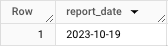
I now need to isolate just the month, 10, using the EXTRACT function.
SELECT EXTRACT(MONTH FROM report_date) AS report_month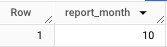
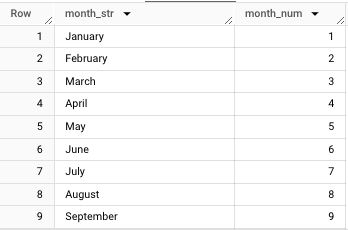
I can now use a neat trick I developed for a prior build: A lookup table that matches a numeric month to its string equivalent.
If you want more details on how that works, the story is below:
Here’s my CTE for that table reference; it’s nothing fancy or complex.
WITH lookup_month AS (

  SELECT month_str, SAFE_CAST(month_num AS INTEGER) AS month_num
  FROM `ornate-reef-332816.billing_sample.lookup_month`
)
And the JOIN that brings everything together… again, just a simple LEFT JOIN of two tables.
SELECT month_str
FROM (
SELECT EXTRACT(MONTH FROM report_date) AS report_month
FROM (
SELECT CURRENT_DATE("America/New_York") AS report_date
))
LEFT JOIN lookup_month
ON lookup_month.month_num = report_month
Which produces our desired output:
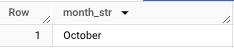
So I’ve solved 50% of my problem. Now I need to this month string to be visible in my Looker report.
Pardon the interruption: To receive more data science-oriented content, consider following Pipeline.
To receive my latest writing, you can follow me as well.
Connecting And Prettify-ing The Output In Looker
First, we’ll connect the view:
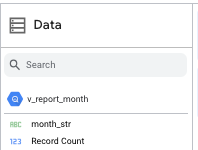
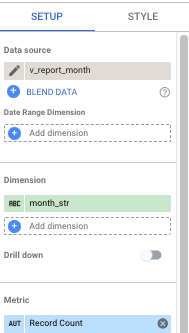
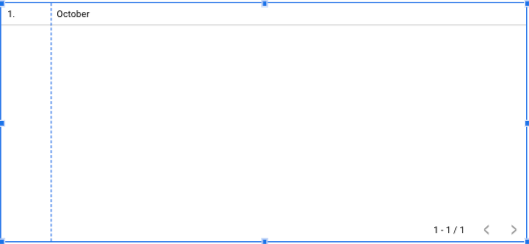
And see that the Record Count field is a default metric. This will cause problems and, at first, not allow us to see “October” by itself.
In addition to Record Count, the row number and pagination that prevents us from isolating “October.”
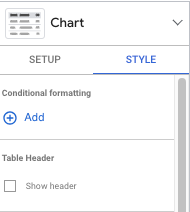
First, we’ll get rid of Record Count (note the x next to the field).
Next we’ll get rid of the header, month_str.
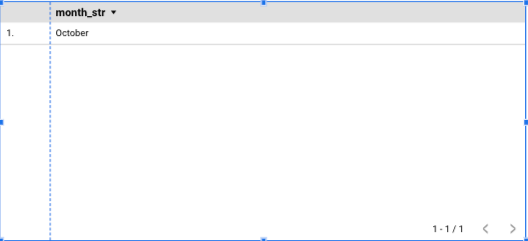
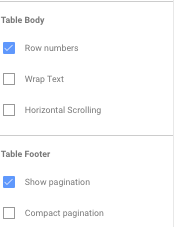
And uncheck the boxes for both row number and pagination…
Now we finally have “October” isolated as a text header.
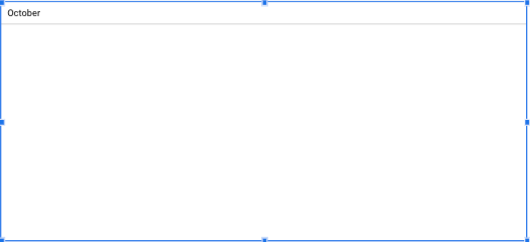
Converting this row value to a header is just a matter of playing with the sizing, font and orientation.

And, to match the initial example, we’ll change the background and bold the text.
There we go!
The best part of this is that this value is not a regular, static text header. You won’t need to change this to “November” or “December” when the time comes because the view will always get the month for the current date.
SELECT EXTRACT(MONTH FROM report_date) AS report_month
FROM (
SELECT CURRENT_DATE("America/New_York") AS report_date
))
Frustration →Solution
Even as a professional, I am probably overly reliant on group think solutions like those posted on Stack Overflow and other forums.
Now, a few years into my role, every time I encounter a problem, whether personal or professional, it takes me back to grad school days when professors would go out of their way to pick problem sets that didn’t live on the Internet.
When you solve a problem with little to no documentation or template, you get a different kind of satisfaction than finding that magical line of Python or SQL that cuts down your work load by a few hours.
Each time you solve a problem with no existing solution, you not only gain knowledge but you also gain a bit of confidence. For newcomers it’s that “I can do it mindset.” For established professionals it’s more of an “I can still do this” feeling.
Either reaction distills the technological role down to its essence: Solving problems. No matter how incrementally.
Create a job-worthy data portfolio. Learn how with my free project guide.


