
4 Best Practices for working with Microsoft Power BI
How to enable an effective Dashboard in Microsoft Environment

Power BI is one of the most popular Business Intelligence tools alongside Tableau, Qlik & Co. Here are my four most important things to look out for if you want to integrate Power BI into your company and use it for data analysis.
Best Practice 1: Data Integration and Preparation
The most important aspect before even analyzing data in Power BI is clean, correct and well-structured data. This means that for example unnecessary columns must be removed, data types must be correct and consistent, and proper data validation must be performed. It is also important to consider data privacy and security.
Here, you can use features like Power BI Data Marts but often especially in company context and large data sets it makes sense to connect Power BI to platforms like a Data Warehouse or Data Lakehouse where data is prepared. The advantage of this is that there is no duplicate data storage and that the data used for machine learning services, ad-hoc analyses or Power BI all have the same basis. In Azure, various options such as Databricks or Azure Synapse are available for this purpose.
Best Practice 2: Data Analysis Expressions (DAX)
DAX is a powerful formula language within Power BI that lets you create custom calculations and aggregations in Power BI. It is a valuable tool for creating calculated columns, metrics and tables that can be used in visualizations and analyses.
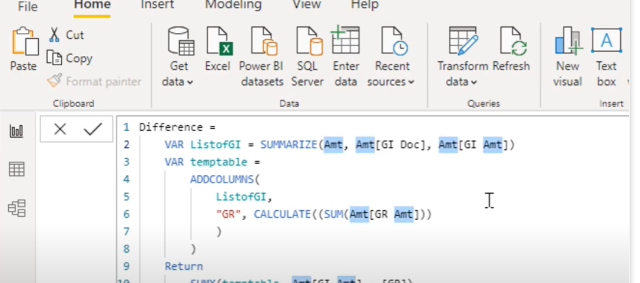
The most important aggregation and cleaning processes should take place in the Data Warehouse & Co. If possible, but for very special values and columns that are only intended for certain departments or reports, columns created with DAX are exactly the right thing. Here, an end user can help himself without costly and time consuming Data Engineer work.
Best Practice 3: Powerful and easy to understand Visualizations
Like other Business Intelligence tools, Power BI offers a wide range of visualization options, from simple charts and graphs to advanced visualizations such as treemaps, heatmaps, etc. When creating visualizations, it is important to choose the right chart type to present your data and to use best practices for data visualization, such as effective use of colors and labels. I have already wrote an article about exactly that topic that might be helpful for you.
Best Practice 4: Optimize Performance
Power BI can be very resource intensive, especially when working with Big Data and very complex visualizations. Here are some of the best practices to tune your reports and dashboards and to reduce of loading times [2][3]:
- Perform major data transformations in the previously stored data platform such as the Data Warehouse.
- Limit the number of visuals and tools like slicers in dashboards.
- Remove unnecessary interactions between visuals.
- Reduce the amount of queries data loaded on page load.
- Ensure that reports and data sources are in the same region.
These are just some tips to tune the performance, feel free to use the sources below for more info on this.
Summary
In my opinion, these are the most important points when working with Power BI. Most of the tips are very generalistic and can also be applied to other BI tools. These relate to the question of how data can be integrated into the tool in an optimized way, the use of DAX functions and the best practices for creating graphics and optimizing reports and dashboards.
Sources and Further Readings
[1] wmfexcel, Quick Tip — Edit #DAX formula in #PowerBI Desktop efficiently (2022)
[2] MAQ Software, 29 Power BI Best Practices (2022)
[3] Microsoft, Optimization guide for Power BI (2023)