
Explore the New Layout Inspector in Android Studio 4.0
Inspect your Android views’ hierarchies with Canary 4.0

A new Layout Inspector was introduced in Android Studio 4.0. It is similar to Chrome DevTools — we can inspect views with IDs, a new 3D view makes it easy to see view hierarchy, and most of all, we can navigate to the exact line of a view’s code from the inspector.
Debugging UI issues has been an issue for Android developers since the beginning. With the Layout Inspector, it’s now easy to find the view hierarchy and pinpoint the issues. We can use the inspector with both physical devices and emulators.
To start the Layout Inspector navigate, go to View > Tools Window > Layout Inspector.
Now, a new window with the Layout Inspector opens at the bottom of the studio. By default, you can see the current screen of the emulator/device in the middle. On the left side, there are layout-related things like the view hierarchy. On the right side of the window, it shows the information about the view that is currently selected. Have a look:
With that said, let’s start digging into the features.
Live Updates
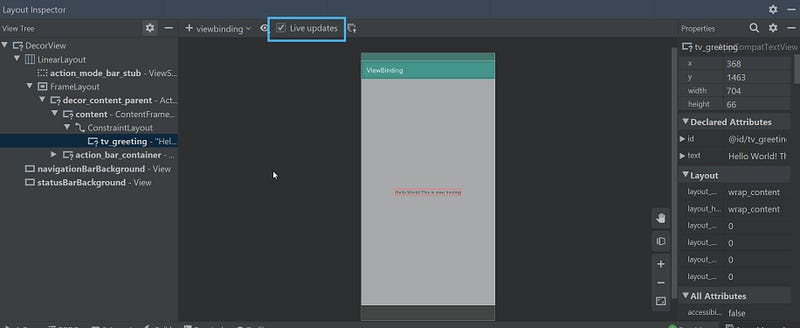
By default, you can inspect the screen that is currently active when you launch the Layout Inspector. But if you want to inspect all the layouts that you can navigate on an emulator/device, then you have to enable the “Live updates” option that is present at the top of the window. Have a look:
3D Rotation
3D rotation is a new feature. As the name indicates, we can see the 3D view of the layout. To be more precise, we can see the view hierarchy. By default, the Layout Inspector launches in 2D mode, and to switch between 2D and 3D, we need to use a rotation icon beside the layout screen at the bottom.
With this 3D rotation, we can see how the view is laid out. The 3D rotation feature is only available on devices API level 29 and above.
Hide Views
Hiding views is another cool feature in the new version of the Layout Inspector. We can hide subviews of a view by right-clicking on the view and selecting the “Show Only Parents” option. Similarly, we can also hide the parent of a view with the “Show Only Subtree” option. Finally, to reset or to show all the views, we can use the “Show All” option.
This feature comes in handy when you’re specifically dealing with a particular part of the layout and you don’t want to get distracted by the entire layout.
Navigation to Code
This is one of my favorite features in the new version. When we click on a view, a new panel will be opened on the right side of the window. This panel contains all the information about the view that was selected by the developer. This information includes all the attributes of the view that you used in the actual layout and additional information like the X and Y coordinates of the view, actual height, and width.
That’s not all. The Layout Inspector will show navigation links under the attributes that were used in the actual layout so that you can navigate directly to that line of code and make changes if necessary. This feature helps us to concentrate on what matters. Have a look:
Search
When a view is inflated on the Layout Inspector, it shows all the attributes — including the ones that we didn’t use in the actual layout — and you can see them on the right panel. Finding what you’re looking for might get tricky in situations like this, and that’s when the search feature comes in handy.
We can search for any attribute with the name or content of the view, as shown in the GIF above.
Bonus
To learn more about Android Studio and debugging, read the following articles:
- Constraint Layout with Live Templates- do less finish more
- Android Studio tips & tricks -Part 1(for beginners)
- Android Studio tips & tricks -Part 2(Advanced)
- Android Studio tips & tricks -Part 3(Debugging)
Thank you for reading.