
Mixpanel — An Effective Product Analytics Tool
A detail guide on mixpanel-browser, the official Mixpanel JavaScript client library

Introduction
Mixpanel is an event analytics service company, founded by Suhail Doshi and Tim Trefren in 2009. The company is a startup with Series C funding, located in San Francisco, California.
Mixpanel is also the tool name, which tracks user interactions with web and mobile applications. This product analytics tool captures data on how users interact with a digital product. The specific data can be used to analyze a product with simple, interactive, and visualized reports.
Mixpanel has 3 plans: Starter, Growth, and Enterprise.
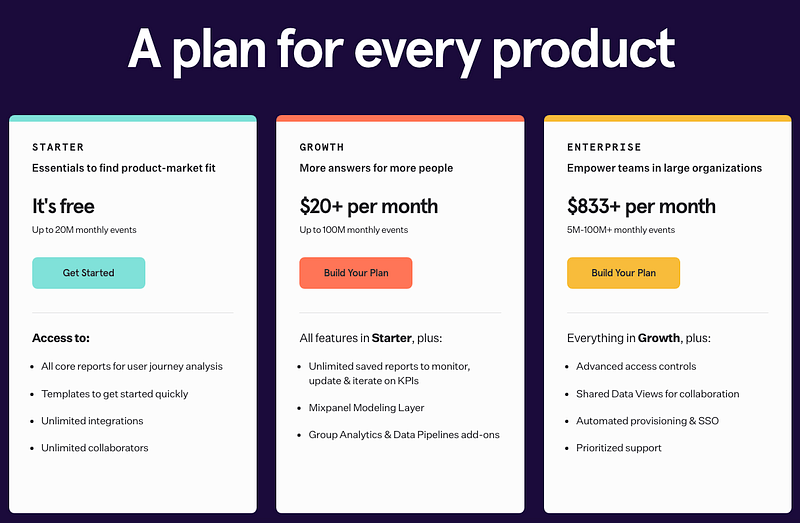
We open a free Starter account to explore the tool.
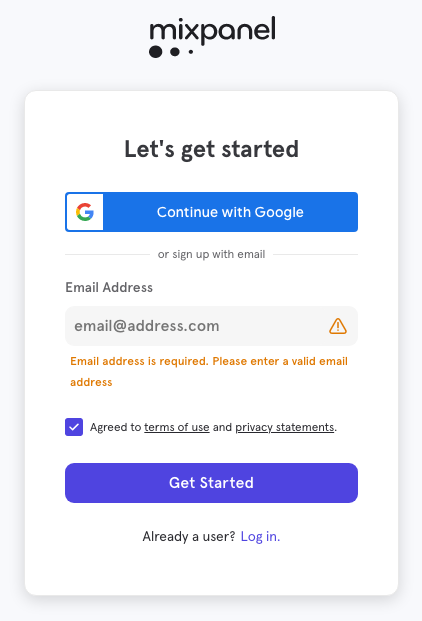
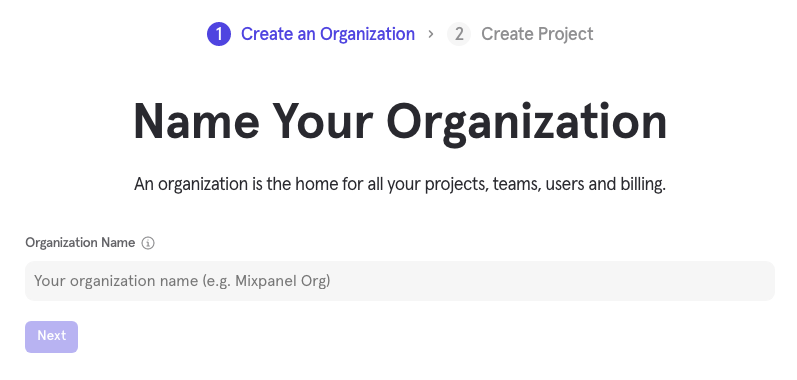
After signing up the account, The organization and the project name are set up in two steps:
Then, the tool is up with empty data.
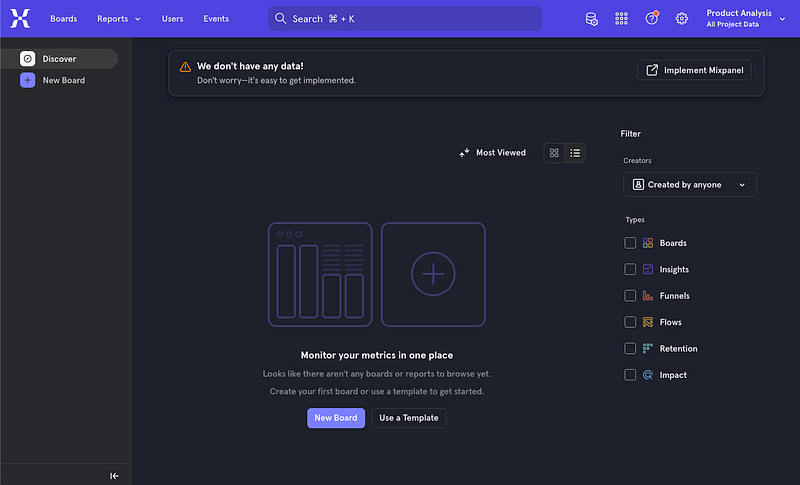
Click the link, Implement Mixpanel, and it opens the Get Started page.
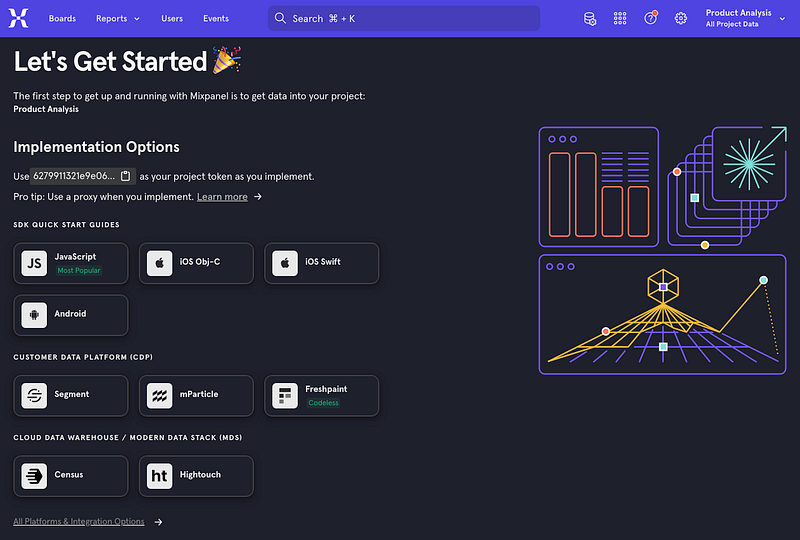
It shows that Mixpanel can be implemented in JavaScript, Obj-C, Swift, and Android. Among these libraries, JavaScript is the most popular one.
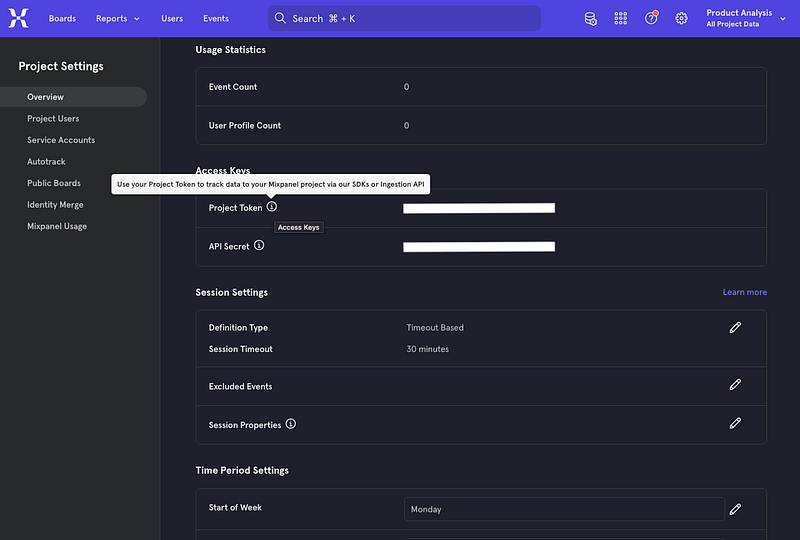
Open the Project Settings page, the generated Project Token will be used in associated applications to track data.
Set Up The Mixpanel Project
For JavaScript, Mixpanel library is named mixpanel-browser. The Create React App working environment is set up to explore Mixpanel.
The following command creates a React project:
% yarn create react-app react-mixpanel
% cd react-mixpanel
Install mixpanel-browser.
% yarn add mixpanel-browser
After the installation, mixpanel-browser becomes part of dependencies in package.json:
"dependencies": {
  "mixpanel-browser": "^2.46.0"
}
Modify src/App.js to use Mixpanel:
import { useEffect } from 'react';
import mixpanel from 'mixpanel-browser';

function App() {
  useEffect(() => {
    mixpanel.init(process.env.REACT_APP_MIXPANEL_PROJECT_TOKEN, {
      verbose: true,
      debug: true,
    });
    mixpanel.identify('Jennifer');
    mixpanel.track('Start App', { host: window.location.host });
  }, []);

  return <div>Test Mixpanel</div>;
}

export default App;mixpanel.init, mixpanel.identify, and mixpanel.track are Mixpanel APIs:
mixpanel.init(token: string, config?: Partial<Config>)initializes a new instance of the Mixpanel tracking object. It takes the project token and some optional properties. Settingdebugto betrueis going to log the Mixpanel events on the browser’s inspect console.verbosewill show debug messages in verbose mode.mixpanel.identify(unique_id?: string)identifies a user with a unique ID to track user activity across devices, tie a user to their events, and create a user profile. The hardcoded user,Jennifer, is a configured user.mixpanel.track(event_name: string, properties?: Dict, optionsOrCallback?: RequestOptions | Callback, callback?: Callback)tracks an event. This is the most important and frequently used Mixpanel function.{ host: window.location.host }is a user defined property.
Here is the Config interface for mixpanel.init:
export interface Config {
  api_host: string;
  api_method: string;
  api_transport: string;
  app_host: string;
  autotrack: boolean;
  cdn: string;
  cookie_domain: string;
  cross_site_cookie: boolean;
  cross_subdomain_cookie: boolean;
  persistence: Persistence;
  persistence_name: string;
  cookie_name: string;
  loaded: (mixpanel: Mixpanel) => void;
  store_google: boolean;
  save_referrer: boolean;
  test: boolean;
  verbose: boolean;
  img: boolean;
  debug: boolean;
  track_links_timeout: number;
  cookie_expiration: number;
  upgrade: boolean;
  disable_persistence: boolean;
  disable_cookie: boolean;
  disable_notifications: boolean;
  secure_cookie: boolean;
  ip: boolean;
  property_blacklist: string[];
  xhr_headers: XhrHeadersDef;
  opt_out_tracking_by_default: boolean;
  opt_out_persistence_by_default: boolean;
  opt_out_tracking_persistence_type: Persistence;
  opt_out_tracking_cookie_prefix: string;
  inapp_protocol: string;
  inapp_link_new_window: boolean;
  ignore_dnt: boolean;
  batch_requests: boolean;
  batch_size: number;
  batch_flush_interval_ms: number;
  batch_request_timeout_ms: number;
}
Here is the Dict interface for mixpanel.track:
export interface Dict {
  [key: string]: any;
}
Execute REACT_APP_MIXPANEL_PROJECT_TOKEN=<Project Token> yarn start, and we will see the tracked event on the browser’s inspect console.
{
"event": "Start App",
"properties": {
"$os": "Mac OS X",
"$browser": "Chrome",
"$current_url": "http://localhost:3000/",
"$browser_version": 112,
"$screen_height": 1152,
"$screen_width": 2048,
"mp_lib": "web",
"$lib_version": "2.46.0",
"$insert_id": "qa7xraniq4isgleq",
"time": 1681661583.864,
"distinct_id": "Jennifer",
"$device_id": <Device ID>,
"$initial_referrer": "$direct",
"$initial_referring_domain": "$direct",
"$user_id": "Jennifer",
"host": "localhost:3000",
"token": <Project Token>,
"mp_sent_by_lib_version": "2.46.0"
}
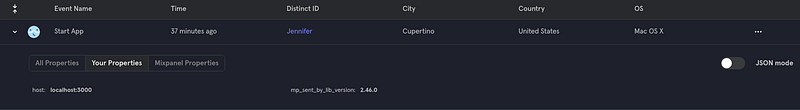
}Go to the Mixpanel tool and open the Events tab, where all events are listed.
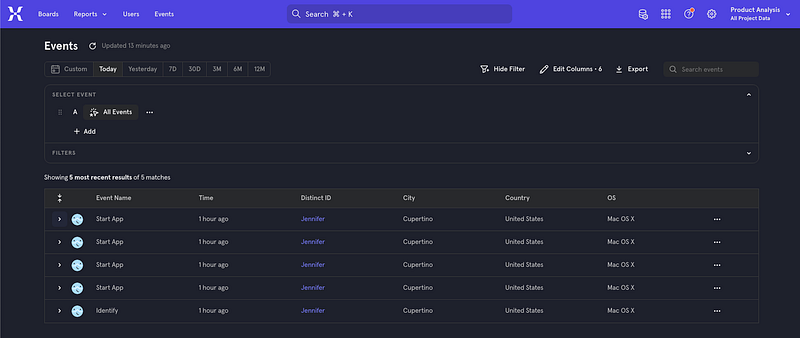
Select the event, Start App, and we can see the tracked event with All Properties, including API information, browser information, geo location, device information, etc.
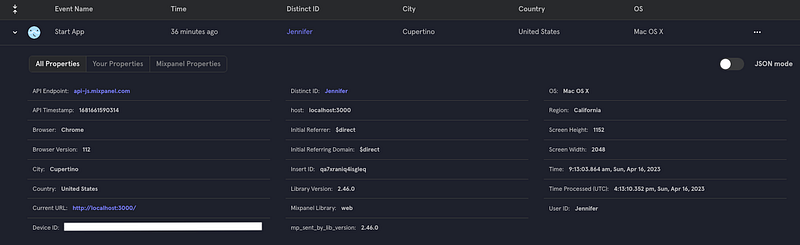
Choose the option Your Properties, and it shows the customized property: host: localhost:3000.
Use Mixpanel to Create Reports
Create a simple user interface with many buttons:
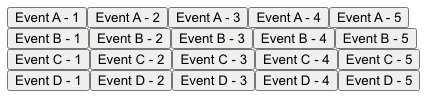
Modify src/App.js to use Mixpanel to track the button clicking events:
import { useEffect } from 'react';
import mixpanel from 'mixpanel-browser';

const getEventButtons = (eventType) => (
  <div>
    {Array(5)
      .fill(1)
      .map((_, index) => {
        const eventName = `Event ${eventType} - ${index + 1}`;
        return (
          <button
            onClick={(e) =>
              mixpanel.track(eventName, { host: window.location.host })
            }
          >
            {eventName}
          </button>
        );
      })}
  </div>
);

function App() {
  useEffect(() => {
    mixpanel.init(process.env.REACT_APP_MIXPANEL_PROJECT_TOKEN, {
      verbose: true,
      debug: true,
    });
    mixpanel.identify(process.env.REACT_APP_MIXPANEL_USER);
    mixpanel.track('Start App', { host: window.location.host });
  }, []);

  return (
    <>
      {getEventButtons('A')}
      {getEventButtons('B')}
      {getEventButtons('C')}
      {getEventButtons('D')}
    </>
  );
}

export default App;
In the code above, the user identity takes an environment variable. This allows us to execute the code on the behavior of different users, by specifying REACT_APP_MIXPANEL_USER=<User Name>.
- Act as
David: ExecuteREACT_APP_MIXPANEL_PROJECT_TOKEN=<Project Token> REACT_APP_MIXPANEL_USER=David yarn start, and click buttons,Event C-4,Event C-3,Event D-3,Event D-2,Event C-2,Event B-2,Event A-2,Event C-3,Event D-1,Event A-1,Event D-5. - Act as
Mary: ExecuteREACT_APP_MIXPANEL_PROJECT_TOKEN=<Project Token> REACT_APP_MIXPANEL_USER=Mary yarn start, and click buttons,Event D- 3,Event C-1,Event D-2,Event B-2,Event B-4,Event C-3,Event D- 4,Event D-4. - Act as
Joe: ExecuteREACT_APP_MIXPANEL_PROJECT_TOKEN=<Project Token> REACT_APP_MIXPANEL_USER=Joe yarn start, and click buttons,Event B-5,Event A-1,Event D-1,Event D-5,Event B-5,Event B-4,Event D-3,Event B-3,Event D-5,Event B-3. - Act as
Jennifer: ExecuteREACT_APP_MIXPANEL_PROJECT_TOKEN=<Project Token> REACT_APP_MIXPANEL_USER=Jennifer yarn start, and click buttons,Event C-4,Event C-3,Event B-3,Event B-2,Event B-2,Event D-1,Event C-3,Event C-3.
Go back to the Mixpanel tool, and open the Events tab, where events is a long list.
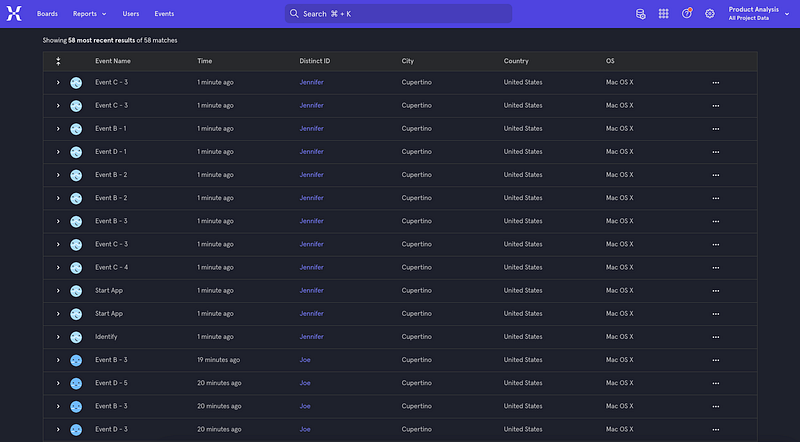
It is hard to view each individual event. That is why Mixpanel’s reports come in handy. The Reports tab shows that there are 4 types reports: Insights, Funnels, Flows, and Retention.
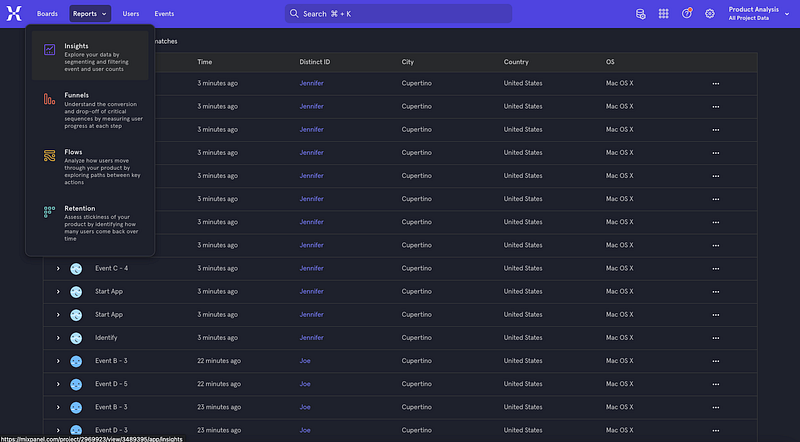
Reports — Insights
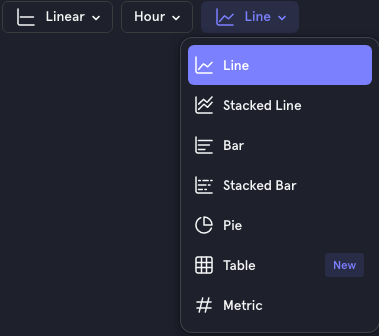
Insights explores data by segmenting and filtering event and user counts. It is the most basic type of report, yet a powerful and flexible one designed to visualize trends and compositions within data. It has the capability to analyze events, cohorts, and user profiles, and display the data in a wide variety of chart types, such as Line, Stacked Line, Bar, Stacked Bar, and Pie. Table and Metric are not really chart types, but they provide useful information.
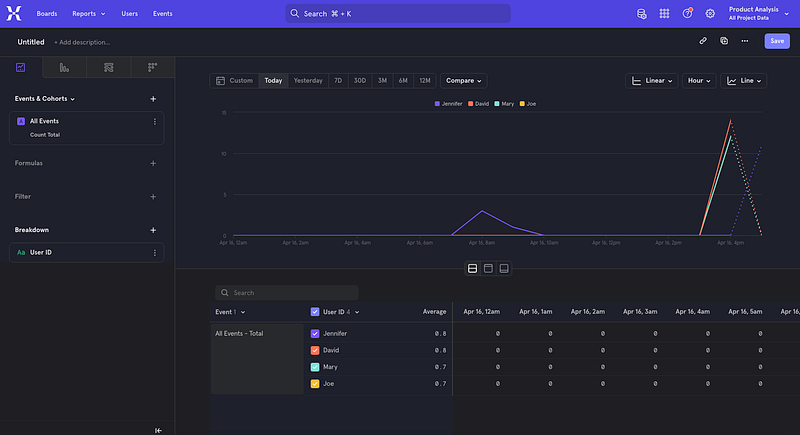
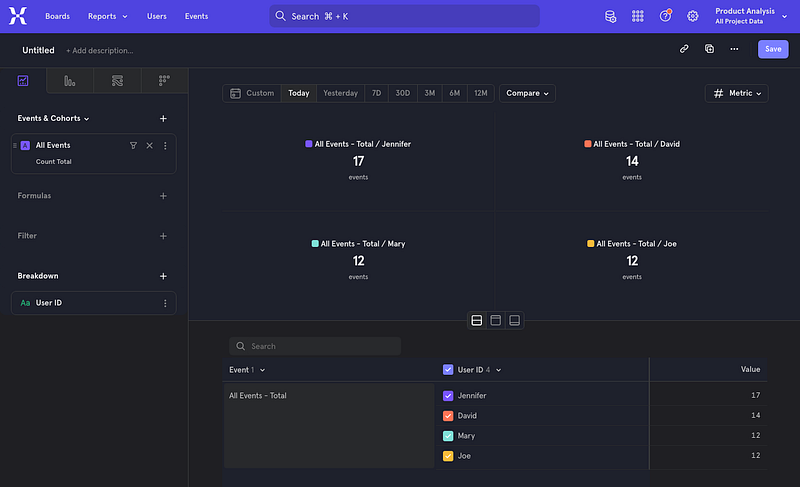
The following report shows the line chart for All Events (Count Total), broken down by User ID.
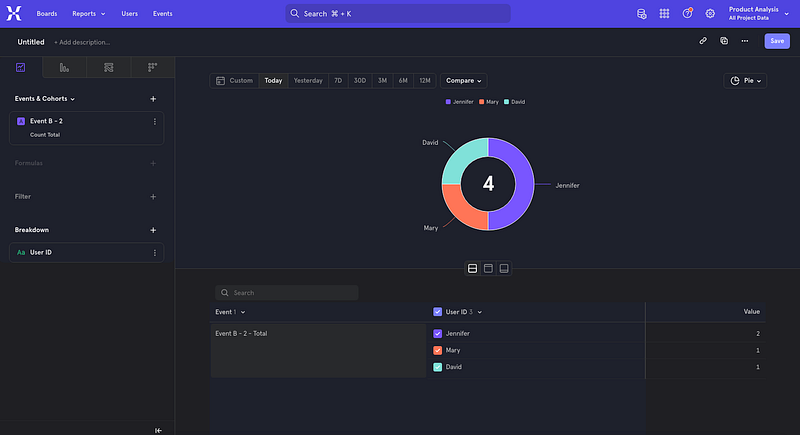
The following report shows the pie chart for Event B — 2 (Count Total), broken down by User ID. It shows that Jennifer has 2 counts, but both Mary and David have 1.
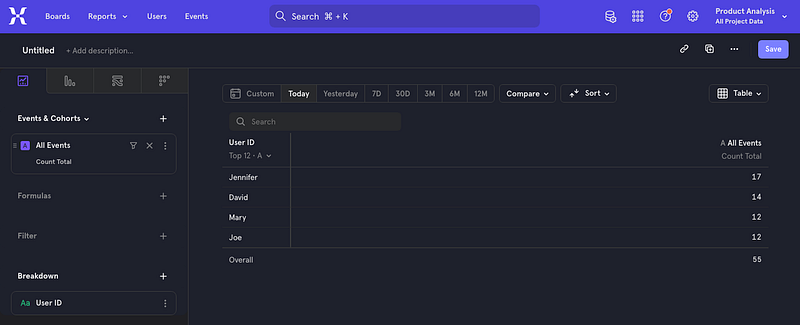
The following report shows the table view for All Events (Count Total), broken down by User ID.
The following report shows the metric view for All Events (Count Total), broken down by User ID.
Reports — Funnels
Funnels examines how end-users perform events in a series. It calculates and displays the amount of users who convert from one event to another within a particular time window. This identifies where the users drop off, what segments convert the most, and other important facets of the user journey.
The following report shows whether a user completing steps in the order of Event B-2 and Event B-3. It shows that Mary, Jennifer, and David performed step 1, Event B-2, but only Jennifer finished Step 2, Event B-3.
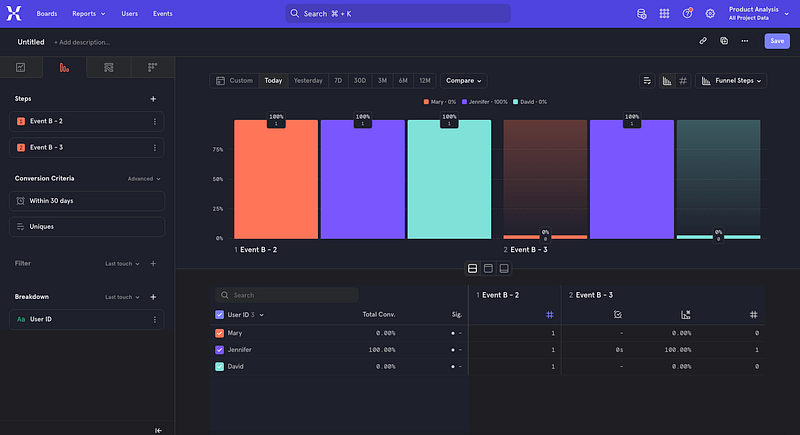
You may notice that Jennifer clicked in the order of Event B-3 and Event B-2. How is she qualified for 100% conversion? It is because Funnels includes a built-in two second grace period. i.e. any consecutive steps that have timestamps within two seconds of one another are interchangeable.
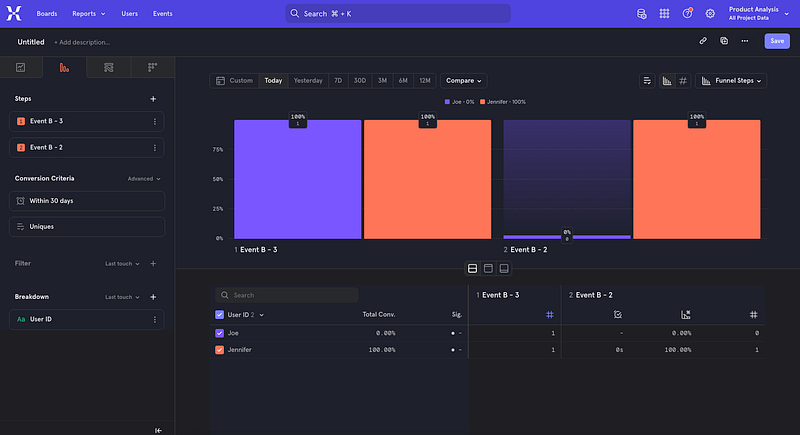
The following report shows whether a user completed steps in the order of Event B-3 and Event B-2. The reverse order shows different data.
Reports — Flows
Flows identifies the most frequent paths taken by users to or from any event. It helps to understand how users sequentially perform events in the product, and analyze drop-offs or unsuccessful behavior.
The following is a Sankey diagram that visually displays how likely other events would happen starting from Event B-2.
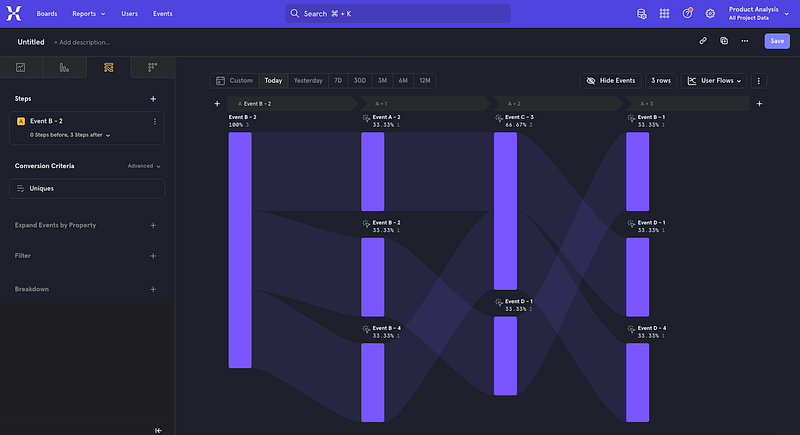
- If
Event B-2happens, there is 33.33% chance forEvent A-2happening, 33.33% chance forEvent B-2happening, and 33.33% chance forEvent B-4happening. - Further, there is 67% chance for
Event B-2happening, and 33.33% chance forEvent B-4happening. - Further, there is 33.33% chance for
Event B-1happening, 33.33% chance forEvent D-1happening, and 33.33% chance forEvent D-4happening.
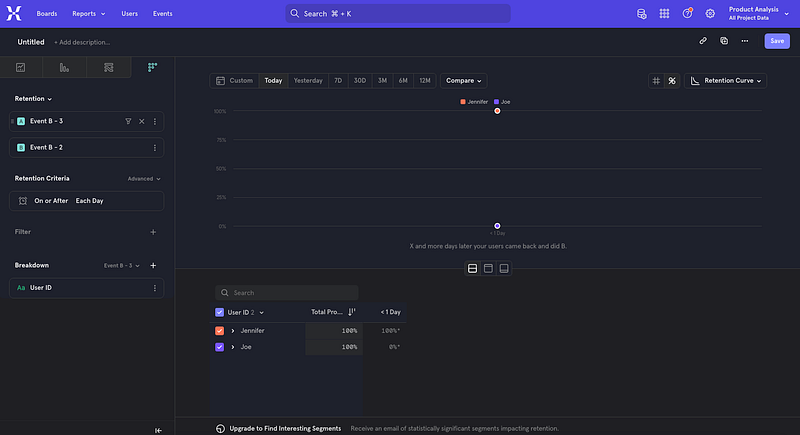
Reports — Retention
Retention is designed to assess user engagement over a specified period of time. Retention of users is critical to achieving product-market fit and sustainable long-term growth, and this report helps to understand how long users continue to come back and find value from the product.
The following report is a very artificial example (1-day statistics), which shows Jennifer is likely to come back, if the retention is based on Event B-3 followed by Event B-2. Interestingly, the two second grace period does not apply here.
Server-Side vs Client-Side Implementation
You try the examples in this article, and it may not work at all if you have an Ad Blocker turned on. We have to turn off Chrome Ad Blocker to run these examples:
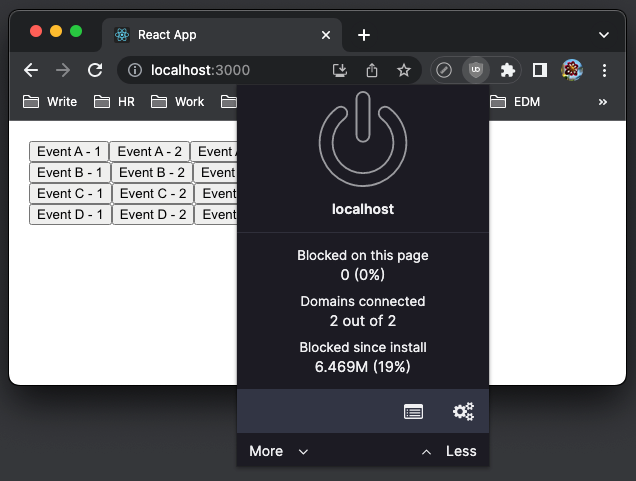
Another solution is to use server side approach, which would work well in Next.js or Remix.
Here is Mixpanel’s recommendation:
- Server-Side (Recommended): The event is generated by the server code. This approach is the most reliable and easy to maintain, since it lives in an environment that you control. However, tracking nuanced client-side interactions or anonymous traffic can be more difficult from the server.
- Client-Side: This means events are sent directly from the website or app to Mixpanel using Javascript or mobile SDKs. This can be faster to set up, but is the least reliable form of tracking due to Ad Blockers. It is also harder to update tracking, since the environment where the tracking code runs is out of the control. It is possible to improve reliability of client-side tracking using a proxy, but this takes more effort.
Conclusion
We have shown how to use Mixpanel APIs in an application to track user interactions and how to use the Mixpanel tool to analyze the application with simple, interactive, and visualized reports.
Mixpanel is an effective product analytics tool. You can open a free account to explore the tool.
Thanks for reading.
Thanks Sean Westbrook, S Sreeram, Pendri Laxmi Prasanna, and Rajasekhar Gandavarapu working with me on Domino products.
Want to Connect?

If you are interested, check out my directory of web development articles.
More content at PlainEnglish.io.
Sign up for our free weekly newsletter. Follow us on Twitter, LinkedIn, YouTube, and Discord.


