
Building ELT pipelines with dbt. (Part 1)
Data transformation (the ‘T’ in ELT) is often regarded as the easy part, but doing so while ensuring data quality — accurate and updated data you can trust — often requires a robust framework and plenty of alignment between various product/engineering teams.
This is the first part of a series about my experience designing data transformation pipelines with dbt, and how we migrated our tasks from our old pipeline to this tool.
The second part of the series covers the pipeline design and techniques, while the third part discusses pipeline optimisation for speed.
Prerequisites
This article assumes you know the basic principles of ELT.
What is dbt?
dbt is a data modeling tool that helps analysts and engineers build scalable, well-documented data transformation tasks. While dbt leverages on SQL, YAML, Jinja templates to build pipelines, it is relatively easy to pick up, even for data analysts who aren’t used to coding.
This provides a good reason for us, the analysts, to use dbt to address several flaws we encountered in our old data transformation pipeline.
A look at our old pipelines
Here’s an illustration how the old transformation pipeline looks like:
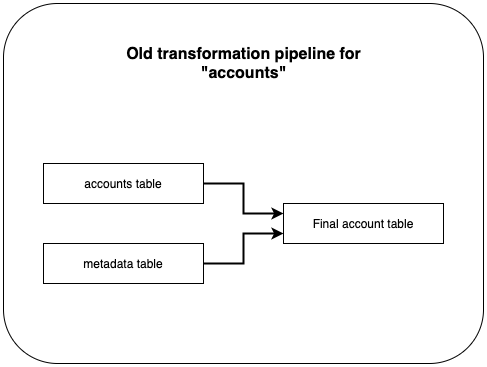
We use Holistics, a BI platform, to transform data from several sources to a usable, analytics-ready table. Our final_accounts_table is a transformation task, and it takes in data from two sources: accounts and metadata.
It seems straightforward, but prior to the day I investigated this pipeline thoroughly, I did not know that accounts and metadata are not source tables. In fact, these are also transformation tasks as it takes in data from other tables into accounts and metadata respectively. So where can I find these tasks, and its raw tables? Well, they may be in Holistics, or a Python script in a github repo. More importantly, all these tasks run independently, and have their own schedule.
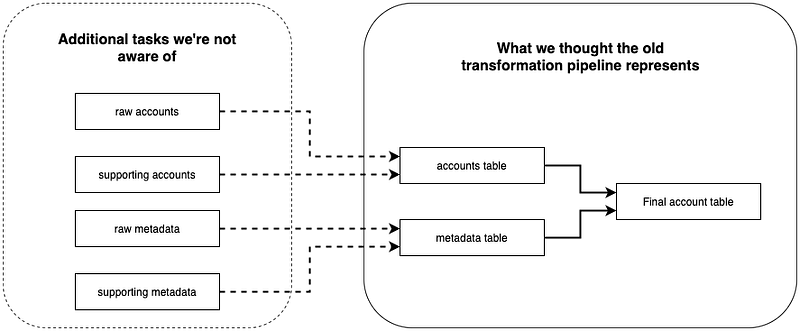
Because the entire flow is not visible to us (the dotted area), we might update the wrong transformations, or miss updating the elusive tasks / scripts we’re not aware of. Coupled with lack of documentation, and quite frequently, long monolith SQL queries, such tasks have become increasingly daunting and chaotic.

How dbt helps us address existing issues in the old pipeline
Issue #1: pipeline that is… not a pipeline.
There is no transparent relationship in our set of transformation processes showing how each task is connected to subsequent transformation tasks down the pipeline. In short, it is basically a collection of “nodes”, and it becomes confusing to fix / update without having a clear view of how data is transformed from sources to the final table, especially for newly onboarded analysts.
Solution: easier relationship management.
dbt helps us manage relationships between tasks with built-in functions such as ref(). This allows us to demonstrate how a task refers to other tasks (known as models) in a pipeline. By using ref(), dbt generates a lineage graph to help us visualise the entire flow from source tables to the final table.
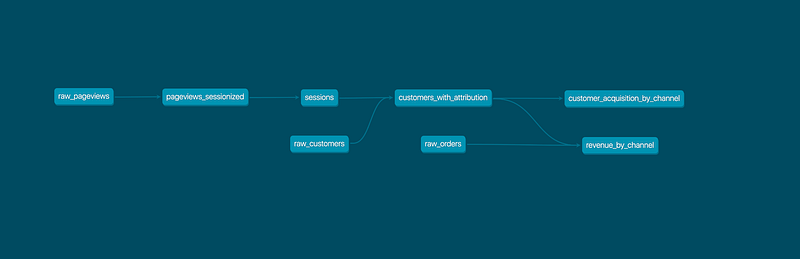
Even though the pipeline above is an example from dbt (not created by me), I can tell there are eight tasks a.k.a. models, the table revenue_by_channel refers data from a source: raw_orders and customers_with_attribution, which derives its data from two more sources: raw_customers and raw_pageviews.
Issue #2: poorly maintained, monolith queries.
The query in our transformation tasks are sometimes not developer-friendly. Indeed, our metadata task includes business logic patches and hardcoded fixes, all jammed into a single, 1,200+ lines of SQL, filled with nested subqueries. This makes it extremely painful to add new updates or apply fixes to the query.
Solution: descriptive, documented models.
dbt introduces models, which essentially are SQL files, but you can think of it as a mini transformation task. Recall that we can create references between models using ref(); we can breakdown not only our monolith metadata task, but the entire accounts pipeline, raw tables and final_accounts_table, into smaller chunks, and each model does a specific function.

Smaller models are easier to read and digest. By looking at the lineage graph, analysts can easily trace step by step, how data in a column was transformed in each model from raw tables to final_accounts_table.
dbt also allows us to document models schema such as column descriptions and tests. Not only do we have clear visualisation on how each task transforms data, we also understand what each column really means.
Bonus Solution: data validation & quality checks.
In addition to this, we can easily integrate tests into our pipeline process to ensure data quality in our final tables. Not only can we implement checks on columns to be unique or contain no NULL values, we can also easily do periodic scans on the most recent data rows in our tables. so we are alerted when a table does not have fresh, updated data. I’ll share more on this in our next article.
Conclusion
To succinctly summarise the above, our main issue with the old pipeline is lack of clarity, both in documentation and tasks relationship in a pipeline, and dbt is a great tool that helps us solve these problems.

Obviously, even a great tool can be rendered useless without proper management. I’ve written down techniques, conventions we use alongside with dbt to build clear, descriptive data transformation pipelines in the next article.
❗️ Interested in what else we work on? Follow us (ShopBack Tech blog | ShopBack LinkedIn page) now to get further insights on what our tech teams do!
❗❗️ Or… interested in us? (definitely, we hope) Check out here how you might be able to fit into ShopBack — we’re excited to start our journey together!


