Decoding the Commodity Super Cycle
Analyzing the long term price movements of the commodities
Natural resources have been the drivers fueling the Industrial revolution in much of the twentieth century. Although the importance of some of these commodities like Oil and other fossil fuels has somewhat waned in light of the tech boom and a move towards a more sustainable way of life, the demand for general commodity sector led by energy, agriculture, livestock, and metals stays strong with an increase in wealth of an ever-growing global population.
What is a Commodity Supercycle?
Commodity Supercycle is defined by the multi-decade price movements in the underlying commodities, which are affected by short term factors like Wars, Famine, Overproduction, Recessions & other cyclical factors. Barring these short term shocks, the larger pattern that emerges shapes the commodity supercycle.
How was the data gathered?
When mapped the commodity supercycles tells us the story of human development — as it coincides with the periods of economic boom, rapid industrialization & modernization. In the supercycle visualized below, the data was gathered from Commodity Price Index (BCPI) — an index created by the Economists at the Bank of Canada to track the prices of 26 commodities produced in Canada & sold globally. The BCPI consisted of the following:
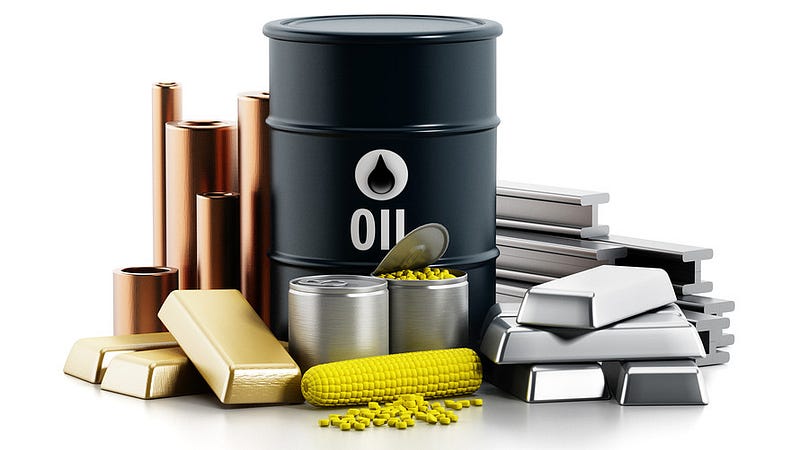
▷ Energy — Coal, Oil, Natural Gas
▷ Metals & Minerals — Gold, Silver, Nickel, Copper, Aluminum, Zinc, Potash, Lead, Iron
▷ Forestry — Pulp, Lumber, Newsprint
▷ Agriculture — Potatoes, Cattle, Hogs, Wheat, Barley, Canola, Corn
▷ Fisheries — Finfish, Shellfish
Commodity Groups
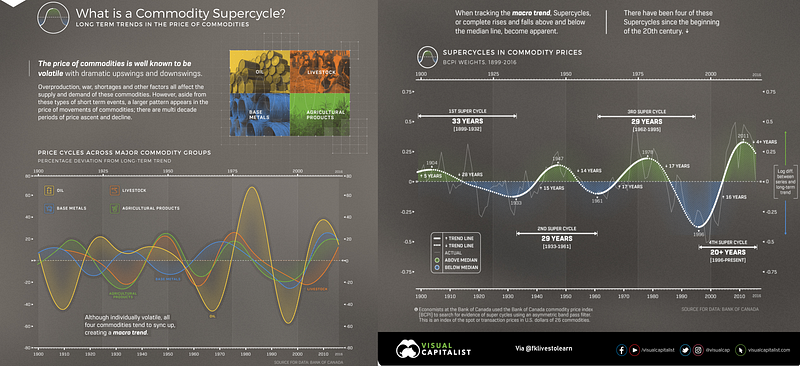
The chart above was constructed using a technique called asymmetric bandpass filter — which identifies patterns or frequencies in sets of data. Price cycles were defined for four major commodity groups namely:
- Oil
- Livestock
- Base metals
- Agricultural Products
Except for Livestock, the last peak of these commodity groups was seen just before the financial crisis of 2008. Whereas oil, base metals & Agricultural products have been declining ever since then, Livestock has been on the ascend. The late 1970s to early 1980s saw the biggest peak by Oil, and late 1990s saw the biggest decline.
Dissecting the Macro Trends
The broader trend shows four supercycles since the beginning of the twentieth century. These four cycles coincide with major economic events around the World.
🞓 1899 to 1932 — The first cycle peak marks the industrialization of the United States in the early twentieth century and ending with the onset of The Great Depression.
🞓 1933 to 1961 — The second cycle peaked right after the second world war with the War machinery was in full swing around the globe, going all the way to early 1960s.
🞓 1962 to 1995 — The third cycle began with the rebuilding of Europe & Japan post the second world war. Reindustrialization of these regions led to a peak in 1978 before troughing in 1996.
🞓 1996 to Present — And the final & fourth supercycle which is currently in progress started with the rise of the free market trade economy & rapid industrialization of China.
Where to now?
What’s noticeable is that the peaks of these commodity supercycles have gotten bigger incrementally with every cycle. Unlike asymmetric growth in earlier decades where different countries took a bigger share of commodities at different times, the new highly intertwined & integrated global economy means simultaneous growth for most regions of the world.
As a result, commodities have become more scarce & valuable with the increased demand. The nations with the greatest access to these precious resources would have the most leverage going forward.
Email 📭| Twitter📜 | LinkedIn 📑| StockTwits 📉 | Telegram 🔗