
Dataframes & JSON with Java on Jupyter
Table of Contents
- Introduction
- Getting Started (Google Colab & Java)
- RSS Feed to JSON
- From JSON to Tablesaw
- Complex Nested Data Structures (Objects & Arrays)
- Querying Nested Objects & Arrays using Tablesaw
Introduction
In previous articles, I demonstrated how we can code with Java in Jupyter Notebooks on Google Colab, use ‘Magics’ to import libraries, and further got our feet wet working with Dataframes using Tablesaw.
In this article, the first of several in this series, we’ll go over some simple examples of how to download and import JSON data using Tablesaw, Google Colab, and a few relevant and handy libraries.
Creating Dataframes From Various File Types Using Tablesaw
Tablesaw provides us with numerous options for importing data into ‘Tables’, which is Tablesaw’s primary class for representing and working with Dataframes.
Options include:
- CSV
- FixedWidth
- Excel
- Parquet
- JSON
- JDBC
- HTML
- Stream → S3, HTTP(S), etc.
Getting Started
Copy the Jupyter Notebook & Load the Java Kernel
We’ll have to assume you are familiar with the concepts covered in the articles above. To speed things along, here is a template of a Jupyter Notebook on GitHub, including the steps needed to download and install the Java Kernel and load useful tools related to Tablesaw, compliments of the team behind Deep Java Learning.
NOTE: for a more detailed walk-through of the below steps. See either of the two previous articles linked above.
From Google Colab, open and create a copy of this notebook:
Connect to a ‘Hosted Runtime’ and execute the provided code blocks.
RSS Feed to JSON

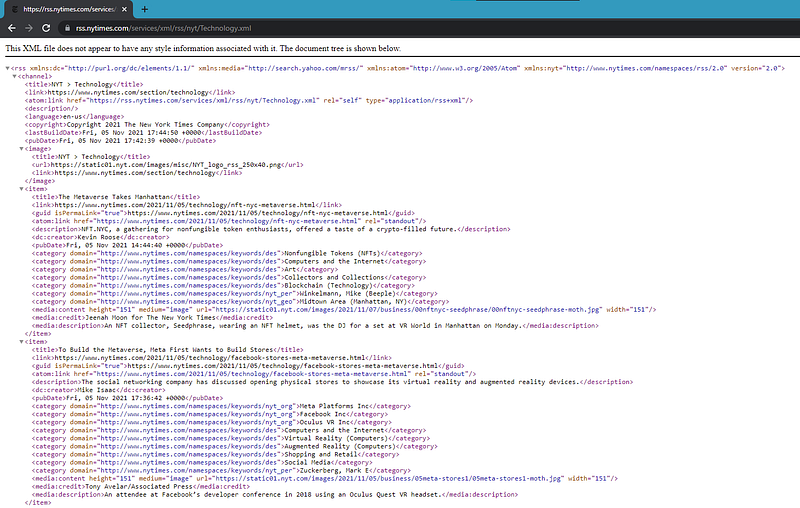
RSS (RDF Site Summary or Really Simple Syndication)[2] is a web feed[3] that allows users and applications to access updates to websites in a standardized, computer-readable format. Subscribing to RSS feeds can allow a user to keep track of many different websites in a single news aggregator, which constantly monitor sites for new content, removing the need for the user to manually check them. News aggregators (or “RSS readers”) can be built into a browser, installed on a desktop computer, or installed on a mobile device
NY Times RSS Feeds
The New York Times provides an RSS Feed for its stories, organized by category.
Convert RSS Feed XML to JSON
As much fun as it can be to work with XML… we’re going to instead transform this feed to JSON, before loading the data into a DataFrame using Tablesaw.
To do this, we’ll use one of many handy services online that we can easily leverage with one or two http calls.
In our case, we’ll use feed2json.org by Andrew Chilton.

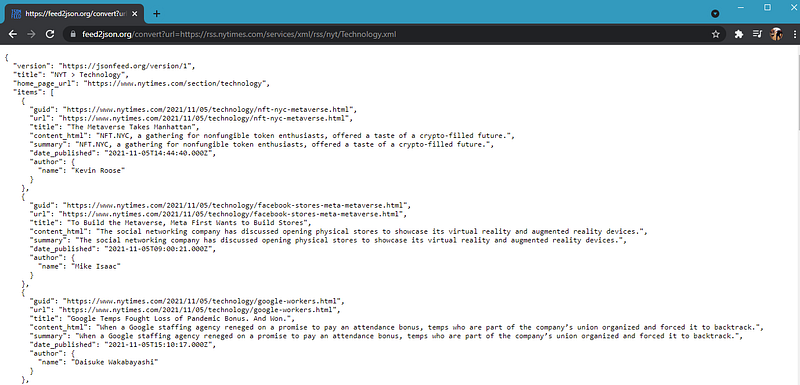
To preview what our downloaded JSON String will look like, we can simply enter the url for making the transformation:
https://feed2json.org/convert
and include the RSS Feed’s url as a query parameter. Here I’ve chosen to view the ‘Technology’ sub-category.
?url=https://rss.nytimes.com/services/xml/rss/nyt/Technology.xmlThe result looks like the following, though the exact contents will vary depending on the news that day.
To download the JSON from this url, we’ll use the ubiquitous Jackson libraries, which can be used for wrangling JSON, CSV, TSV, XML, and likely more text-based formats that I’ve yet to discover myself. It’s one of several popular libraries for mucking with such data in Java.
By now, I imagine you’re familiar with the Magic provided by IJava. In this case, the %%loadFromPOM allows us to load dependencies using Maven xml snippets, as follows:
%%loadFromPOM
<dependency>
    <groupId>com.fasterxml.jackson.core</groupId>
    <artifactId>jackson-core</artifactId>
    <version>2.13.0</version>
</dependency>
<dependency>
    <groupId>com.fasterxml.jackson.core</groupId>
    <artifactId>jackson-databind</artifactId>
    <version>2.13.0</version>
</dependency>
After first downloading the JSON as a list of java.util.Map objects, in a separate code block in your Notebook, we’re going to print the JSON to a String using the ‘PrettyPrinter’ option to include line breaks & indenting for readability, and finally printing just the first 25 lines with the java.util.Scanner.
From JSON to Tablesaw (DataFrame)
Finally, we’re ready to ingest this data to form a Table (DataFrame) using Tablesaw.
Again, we’re going to use %%loadFromPom Magic to download the dependencies.
%%loadFromPOM
<dependency>
  <groupId>tech.tablesaw</groupId>
  <artifactId>tablesaw-core</artifactId>
  <version>0.41.0</version>
</dependency>
<dependency>
  <groupId>tech.tablesaw</groupId>
  <artifactId>tablesaw-json</artifactId>
  <version>0.41.0</version>
</dependency>
<dependency>
    <groupId>commons-io</groupId>
    <artifactId>commons-io</artifactId>
    <version>2.11.0</version>
</dependency>
Now, before we create a table, let’s look again at the structure of our JSON output. The articles themselves, which will make up the ‘rows’ of our table, are actually stored in an array called ‘items’ in the RSS page.
To extract just those items, we’ll simply create an additional string using String items = writer.writeValueAsString(map.get(“items”));
Now, we’re ready to create our first Table from our JSON list of articles.
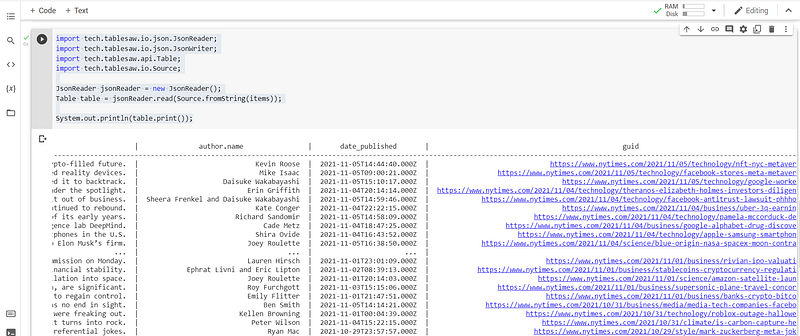
To complete our first example, we’ll end with a simple query. You’ll notice that the ‘author’ object from our JSON output includes a single field, ‘name’, in most cases. We can query for articles by the author’s name using something like the following.
Table byName = table.where(table.stringColumn("author.name")
                    .isEqualTo("Erin Griffith"));

System.out.println(filtered.print());
Now, you might be saying that this example was trivial because we limited ourselves to a relatively vanilla dataset where the JSON structure of the records making up our table were comprised of almost entirely basic fields, with little to no complex sub-structures (arrays, nested objects, etc.), with the author.name being the one somewhat simple exception.
In our next example, we’ll explore what it looks like to ingest and query more complex data structures using data from Project Gutenberg.
Complex Nested Data Structures
We’ve only scratched the surface of what we might find represented as JSON data. JSON data can be used to represent much more complex data structures. It might help if we take a step back and remind ourselves of what can be expected with JSON.
So, what again is JSON, exactly?
JavaScript Object Notation, It is the data-interchange language independent format and it is easier to understand for both machines and humans. So it is widely used in the area of communication between different software systems.* JSON can represent information about a single item or a collection of items.* With less content JSON is able to represent complex data in meaningful form.* JSON is formed by structuring strings with special characters like, { }, [ ], ‘,’, ‘:’.* The basic building block of JSON data is key-value pairs.* Key-value pair is expanded into different forms to represent Value, Object and Collections.-- From "JSON Data Format : Explanation", by Jayakrishnan Pm.
-- Original text can be found at: https://devdeeds.com/json-way-represent-complex-data-structures/For an even more in-depth description of the JSON format, you can reference the original json.org documentation, where you can find somewhat confusing diagrams like the following, as well as some more helpful text about the JSON specification.
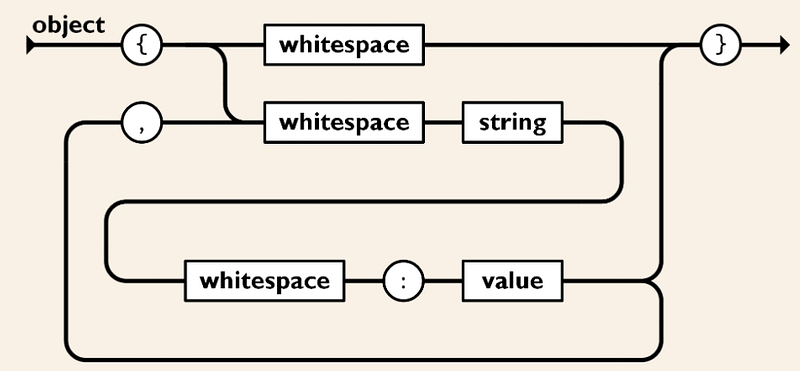
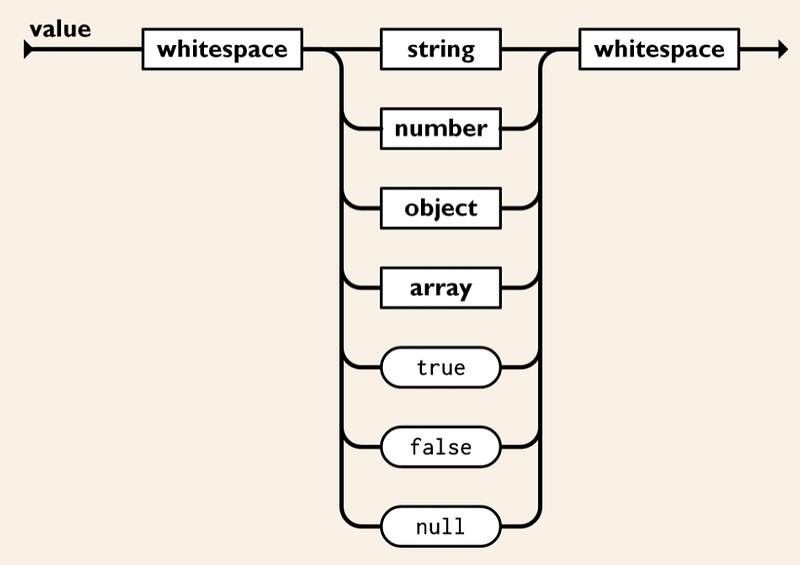
I tease, but I won’t really try to provide a detailed explanation of JSON here. Many more very capable minds before me have done some excellent work in this regard.
What we need to know for our next example, is that complex data structures can be represented in a DataFrame, using any one of several approaches to piece apart the data into ‘rows’ of data.
Now, you might argue here that we should instead be using a Document or Object Store like MongoDb, and you’re not wrong, necessarily, but that’s not what we’re doing, and I’ll leave the why up to you to discover (or to justify to your overly curious and sometimes sadistic developer mind).
Working with Complex Nested Data Structures using Project Gutenberg Data
As we dive deeper into how to work with more complex JSON data using Tablesaw, we’re going to use data from Project Gutenberg for our examples.
What is Project Gutenberg?
Project Gutenberg (PG) is a volunteer effort to digitize and archive cultural works, as well as to “encourage the creation and distribution of eBooks.”[2] It was founded in 1971 by American writer Michael S. Hart and is the oldest digital library.[3] Most of the items in its collection are the full texts of books in the public domain. The Project tries to make these as free as possible, in long-lasting, open formats that can be used on almost any computer. As of 22 May 2021, Project Gutenberg had reached 65,405 items in its collection of free eBooks.[4]
— Project Gutenberg on Wikipedia
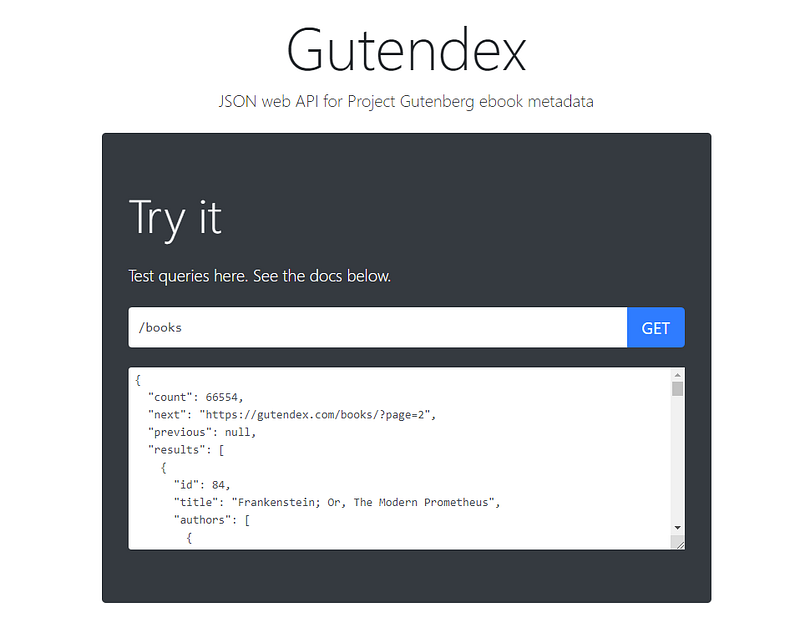
There are several sources of Project Gutenberg data out there. We’ll be referencing the Gutendex API in our examples.
What is Gutendex?
Gutendex is a simple, self-hosted web API for serving book catalog information from Project Gutenberg, an online library of free ebooks.
RW the Data
Let’s get started by simply repeating some of what we’ve learned above.
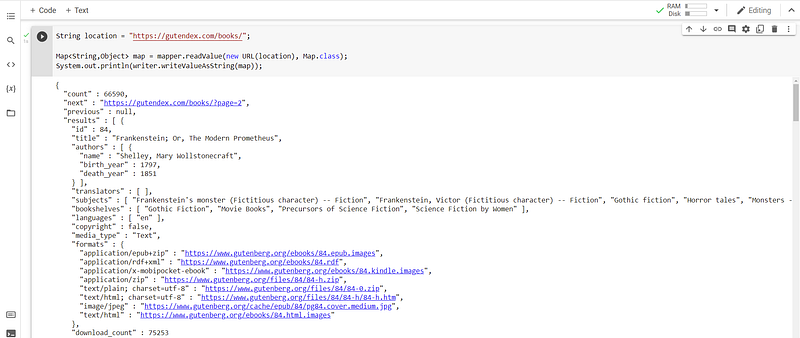
Load JSON into a DataFrame with Tablesaw
Reading JSON with Tablesaw is now trivial, if we first remember to extract the array of JSON objects of interest, what will become our rows of data. Below, this is the purpose of (List<Map<String, Object>>)map.get(“results”);.
NOTE: If you try to load a single JSON object, absent the [ and ] brackets to make the array, you’ll get an exception like the following:

View from Google Colab
Executing the code snippet in Google Colab, assuming previous steps to first download the data, and use of Magics to load any required dependencies with Maven (see above).
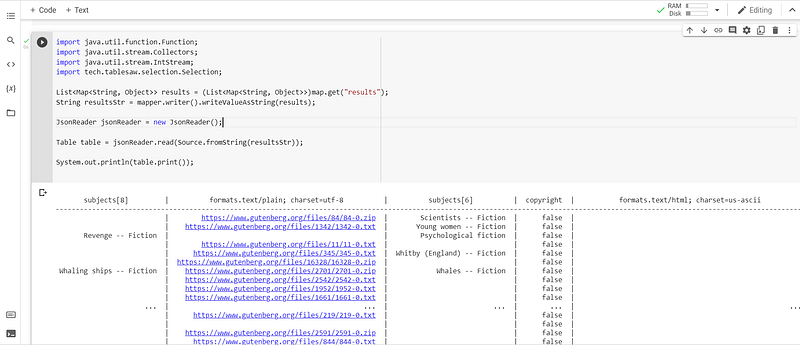
Complex Data Structures
Nested Objects
Tablesaw loads nested objects as columns, using dot notation to reference the child objects individual fields. For example, in the Gutendex data, formats are referenced in the image above. Two of the several different formats are fields within the formats object.
- formats.text/plain; charset=utf-8
- formats.text/html; charset=us-ascii
Each field contains a link to the relevant file containing the indicated format’s file. Here are a few examples.
     formats.text/plain; charset=utf-8
-------------------------------------------------https://www.gutenberg.org/files/84/84-0.zip
https://www.gutenberg.org/files/1342/1342-0.txt
https://www.gutenberg.org/files/11/11-0.txt
Nested Arrays
Arrays are referenced by giving each entry in the array an indexed column. The number of columns are dictated by record with the highest number of objects within a given array. In the above image, we see subjects[8] and subjects[6], but there are also subjects[0–9].
We can query for and list the number of columns for a given array within a record using a query like the following:
// get 'subjects' columns
List<String> subjectCols =
    table.columnNames().stream()
         .filter(n -> n.matches("subjects\\[[0-9]+\\]"))
         .collect(Collectors.toList());

System.out.println(subjectCols);

// results from println
// -> [subjects[8], subjects[6], subjects[4], subjects[2],
//    subjects[1], subjects[9], subjects[7], subjects[5],
//    subjects[3], subjects[0]]
Query Nested Structures
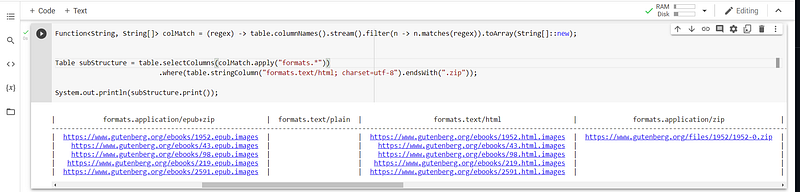
To query nested objects, we can use Tablesaw’s Selection interface and Java 8’s functional interfaces.
Query Nested Arrays
Below we will query for all books where ‘subjects’ contains ‘Fiction’.
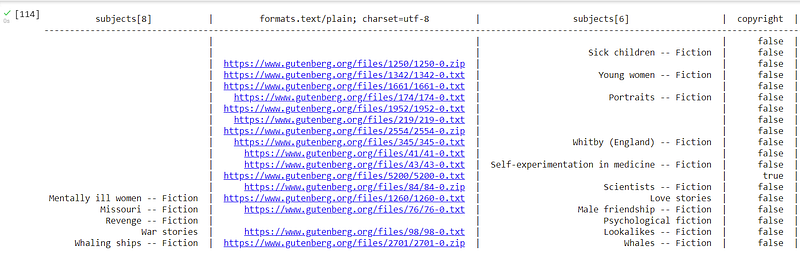
NOTE: our results will contain all records where any of it’s subject entries contain the word ‘Fiction’.
Query Nested Objects
In this example we will query for all books where formats.formats.text/html; charset=utf-8 contains an entry ending with .zip.
Conclusion
With the help of some Magic, a run of the mill Tablesaw, and a little grit, we’ve wrangled us some JSON to serve up some data on a Table, making it easy to perform familiar Table oriented operations.
This is only the beginning, of course. There’s so much more you can do with Tablesaw, Google Colab, etc.. I hope this helps get you started, though.
I look forward to seeing more examples from all of you.
So, get creative, and don’t forget to Show Your Work!!
Ready For More?
- Apache Spark with Java on Jupyter
- Tidy Data with Java & Jupyter
- Dataframes with Java and Google Colab (Jupyter)— CSV
- Java, Jupyter & Plotly
Note from the Author
In addition to the material covered above, I’d love to hear back from anyone exploring how to use Java in the context of Notebooks (Jupyter, Zeppelin, etc.) and on the command line (JShell) for data processing and visualization using tools like Tablesaw.
Shoot me a message, especially if you have published any material on Medium, and I’ll be happy to link to your content in the future, when relevant.


