
Dataframes and CSV with Java on Jupyter
Some simple examples of how to download, import/export, & query CSV data as Dataframes using Java on Google Colab (Jupyter).

Introduction
In previous articles, I demonstrated how we can code with Java in Jupyter Notebooks on Google Colab, use ‘Magics’ to import libraries, and further got our feet wet working with Dataframes using Tablesaw.
In this article, the first of several in this series, we’ll go over some simple examples of how to download and import CSV data using Tablesaw, Google Colab, and a few relevant and handy libraries.
Creating Dataframes From Various File Types Using Tablesaw
Tablesaw provides us with numerous options for importing data into ‘Tables’, which is Tablesaw’s primary class for representing and working with Dataframes.
Options include:
- CSV
- FixedWidth
- Excel
- Parquet
- JSON
- JDBC
- HTML
- Stream → S3, HTTP(S), etc.
Getting Started
Copy the Jupyter Notebook & Load the Java Kernel
We’ll have to assume you are familiar with the concepts covered in the articles above. To speed things along, here is a template of a Jupyter Notebook on GitHub, including the steps needed to download and install the Java Kernel and load useful tools related to Tablesaw, compliments of the team behind Deep Java Learning.
NOTE: for a more detailed walk-through of the below steps. See either of the two previous articles linked above.
From Google Colab, open and create a copy of this notebook:
Connect to a ‘Hosted Runtime’ and execute the provided code blocks.
Remembering “Magics”
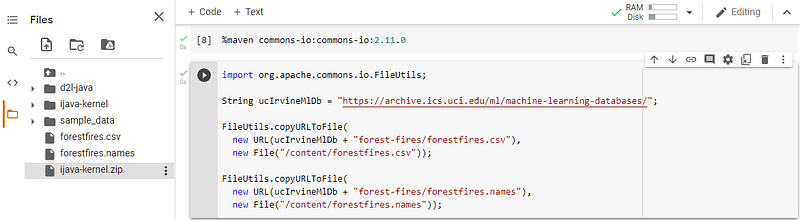
%maven commons-io:commons-io:2.11.0Download Files Quickly with Apache Commons IO FileUtils
From the UC Irvine Machine Learning Repository, we’re going to download a data set that was used by P. Cortez and A. Morais¹ in their paper, “A Data Mining Approach to Predict Forest Fires using Meteorological Data”.
Afterward, you should see ‘forestfires.csv’ and ‘forestfires.names’ in your default work directory on Google Colab, as shown below.
Next, let’s open and preview the ‘forestfires.names’ file, which contains detailed description of the structure of the csv, the authors, how to cite use of this data, and some history behind the data.
import java.nio.file.Files;
import java.nio.file.Path;Files.copy(Path.of("/content/forestfires.names"), System.out);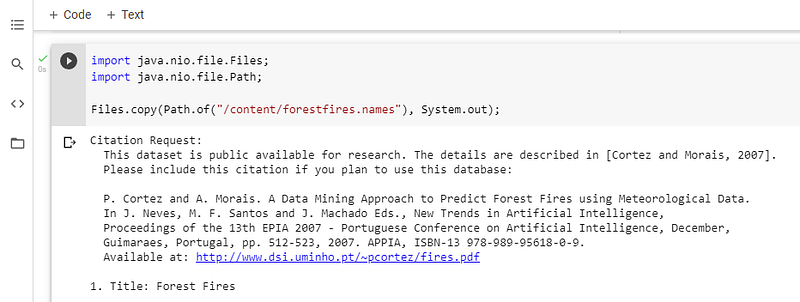
The structure of the data described in this file is as follows:
Attribute information:For more information, read [Cortez and Morais, 2007].1. X - x-axis spatial coord. within the Montesinho park map: 1 to 9
2. Y - y-axis spatial coord. within the Montesinho park map: 2 to 9
3. month - month of the year: "jan" to "dec"
4. day - day of the week: "mon" to "sun"
5. FFMC - FFMC index from the FWI system: 18.7 to 96.20
6. DMC - DMC index from the FWI system: 1.1 to 291.3
7. DC - DC index from the FWI system: 7.9 to 860.6
8. ISI - ISI index from the FWI system: 0.0 to 56.10
9. temp - temperature in Celsius degrees: 2.2 to 33.30
10. RH - relative humidity in %: 15.0 to 100
11. wind - wind speed in km/h: 0.40 to 9.40
12. rain - outside rain in mm/m2 : 0.0 to 6.4
13. area - the burned area of the forest (in ha): 0.00 to 1090.84(this output variable is very skewed towards 0.0, thus it may make sense to model with the logarithm transform).Creating Tables from CSV Files
This next part is easy, provided you have a CSV file that conforms to one of several common formats, which may often not be the case, as we’ll see later.
Table table = Table.read().csv("/content/forestfires.csv");
table.print(20);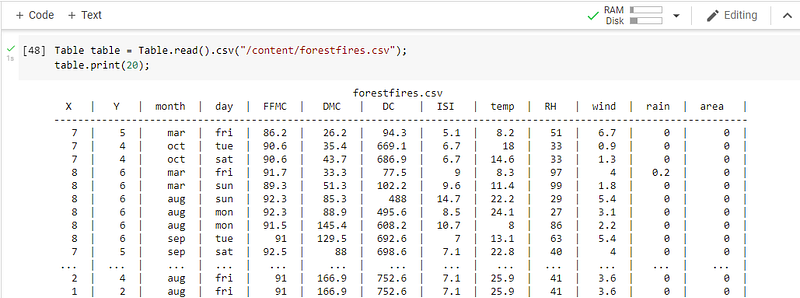
Tablesaw attempts to detect the appropriate type for your columns. You can print out the assumptions made by evaluating the ColumnType.
> table.columns().forEach(c -> System.out.println(c.type()));INTEGER INTEGER STRING STRING DOUBLE DOUBLE DOUBLE DOUBLE DOUBLE INTEGER DOUBLE DOUBLE DOUBLESometimes we’re going to want to specify the ColumnType. As of version 0.41.0 Tablesaw supports the following data types:
# Numeric
DOUBLE, FLOAT, INSTANT, INTEGER, LONG, SHORT
# Date/Time
LOCAL_DATE, LOCAL_DATE_TIME, LOCAL_TIME, # Misc.
STRING, TEXT, BOOLEANTo specify what data types we want to use, we can include as much in CsvReadOptions, at the time of import.
S3
Importing data from AWS S3 is almost as easy. We’re going to demonstrate using data that is openly available in the Registry of Open Data on AWS. Specifically, we’ll be downloading some of the data available on the Covid Job Impacts (US Hiring Data Since March 1 2020). This data is made available under a Creative Commons license, and managed by Greenwich.HR ([email protected]).
This dataset provides daily updates on the volume of US job listings filtered by geography industry job family and role; normalized to pre-covid levels…
… Data is derived from online job listings tracked continuously, calculated daily and published nightly. On average data from 70% of all new US jobs are captured, and the dataset currently contains data from 3.3 million hiring organizations.
The documentation regarding the structure and description of this dataset can be found here.
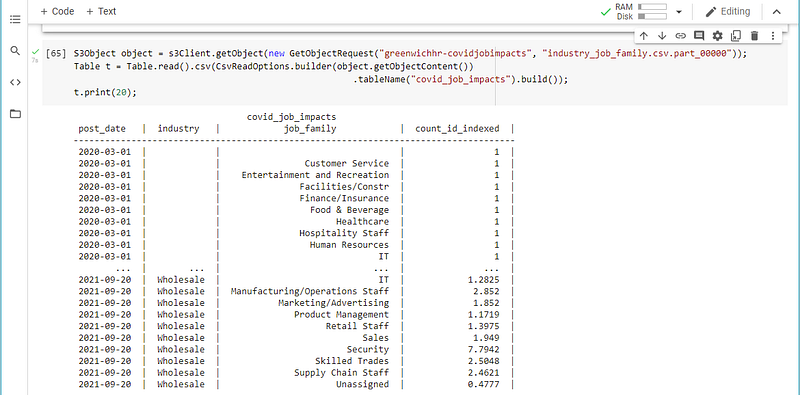
As above, we’re going to download this data and import it into a Table using Tablesaw.
First, we’ll use our trusty Magic to import the necessary AWS SDK for Java.
%maven com.amazonaws:aws-java-sdk-s3:1.12.90From the site where we found the Covid Job Impact data, we’ll need the S3 Bucket Name & Region.
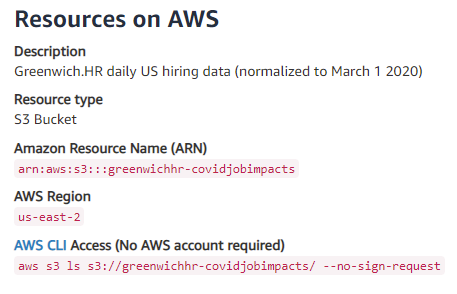
The Bucket Name is greenwichhr-covidjobimpacts, and the Region is us-east-2. Because this is an ‘Open’ dataset, we don’t need any form of authentication, we just need a working S3 client.
Enter the following into a code block to first list out the objects in the bucket.
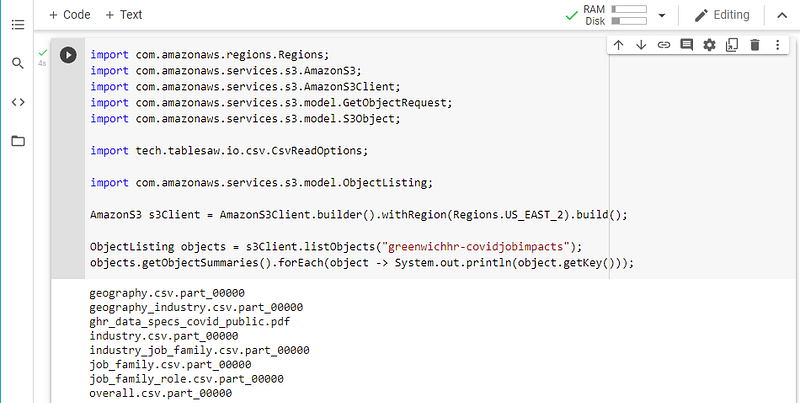
Next, let’s first identify one object to download. Let’s start with industry_job_family.csv.part_00000. Finally, we’ll download the object and import it into a table using CsvReadOptions.builder(InputStream stream){}.
Conclusion
That’s it! Well, that at least get’s you started, I hope. There’s quite a bit more to importing data, even just CSV, and I hope to go over some of those specifics in upcoming articles.
In the meantime, you can explore what Tablesaw has currently documented about importing data on their website here.
I’d love to hear back from anyone exploring how to use Java in the context of Notebooks (Jupyter, Zeppelin, etc.) and on the command line (JShell) for data processing using tools like Tablesaw. Shoot me a message, especially if you have published any material on Medium, and I’ll be happy to link to your content in the future, when relevant.
References
- [Cortez and Morais, 2007] P. Cortez and A. Morais. A Data Mining Approach to Predict Forest Fires using Meteorological Data. In J. Neves, M. F. Santos and J. Machado Eds., New Trends in Artificial Intelligence, Proceedings of the 13th EPIA 2007 — Portuguese Conference on Artificial Intelligence, December, Guimarães, Portugal, pp. 512–523, 2007. APPIA, ISBN-13 978–989–95618–0–9. Available at: [Web Link]
Ready for More?
- Apache Spark with Java on Jupyter
- Tidy Data with Java & Jupyter
- Dataframes & JSON with Java on Jupyter
- Java, Jupyter & Plotly

Note from the Author
In addition to the material covered above, I’d love to hear back from anyone exploring how to use Java in the context of Notebooks (Jupyter, Zeppelin, etc.) and on the command line (JShell) for data processing and visualization using tools like Tablesaw.
Shoot me a message, especially if you have published any material on Medium, and I’ll be happy to link to your content in the future, when relevant.


